San Juan County, Colorado (CO)
County owner-occupied free and clear houses and condos in 2010: 89
County owner-occupied houses and condos in 2000: 181
Renter-occupied apartments: 134 (it was 88 in 2000)
| % of renters here: | 33% |
| State: | 34% |
Land area: 387 sq. mi.
Water area: 0.9 sq. mi.
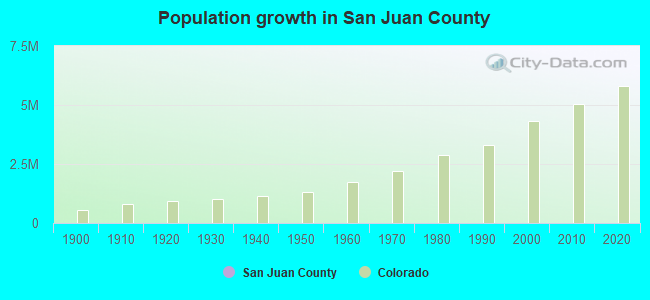
Population density: 2 people per square mile (very low).
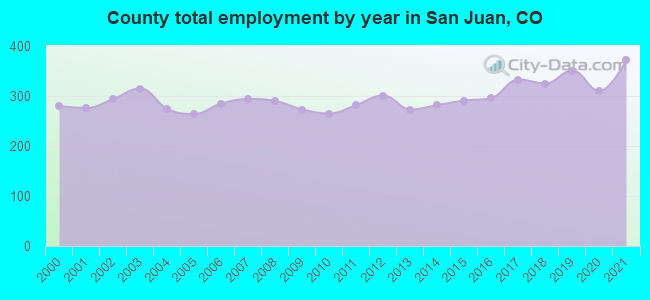
Industries providing employment: Retail trade (22.4%), Educational, health and social services (22.1%), Arts, entertainment, recreation, accommodation and food services (20.3%).
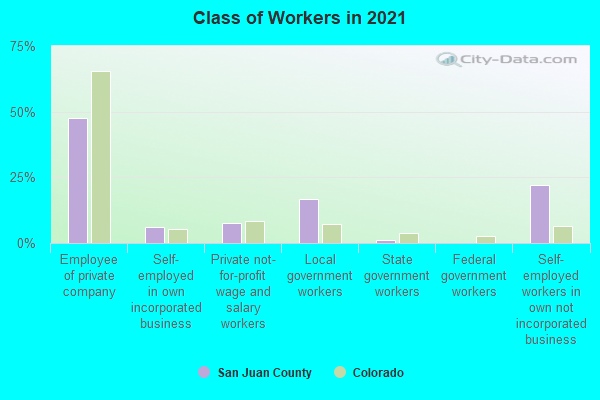
Type of workers:
- Private wage or salary: 60%
- Government: 19%
- Self-employed, not incorporated: 21%
- Unpaid family work: 0%
- OSM Map
- General Map
- Google Map
- MSN Map

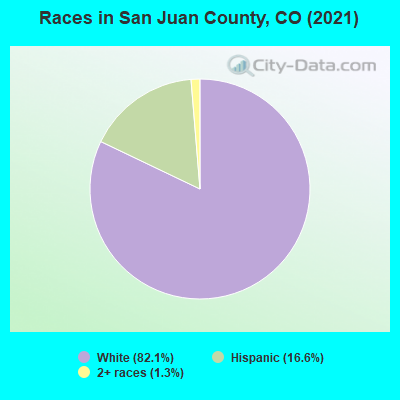
- 53677.5%White Non-Hispanic Alone
- 13018.8%Hispanic or Latino
- 223.2%Two or more races
- 40.6%American Indian and Alaska Native alone
| Median resident age: | 49.8 years |
| Colorado median age: | 37.7 years |
| Males: 375 | |
| Females: 323 |

 | Closing Black Bear Pass? (53 replies) |
| COVID-19 General Colorado Thread (845 replies) |
| Official Thread for all 2020 Colorado Fire Season Topics (183 replies) |
| Avalanche and Snow Slide Thread (51 replies) |
| COVID-19 Governor Polis issues state-wide stay at home order (166 replies) |
| Official 2018-2019 Colorado Winter and Snow Thread (190 replies) |
| San Juan County: | 2.0 people |
| Colorado: | 2 people |
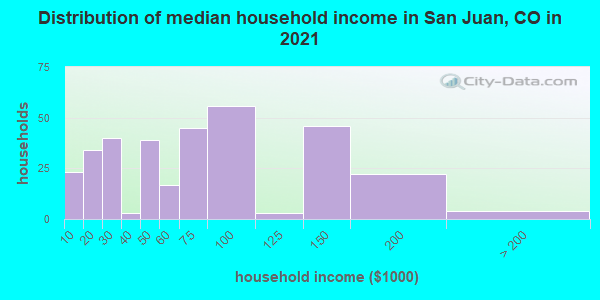
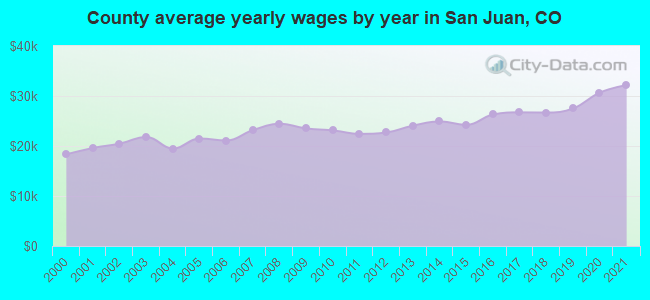
Estimated median household income in 2022: $68,654 ($30,764 in 1999)
| This county: | $68,654 |
| Colorado: | $89,302 |
Median contract rent in 2022 for apartments: $823 (lower quartile is $627, upper quartile is $1,091)
| This county: | $823 |
| State: | $1513 |
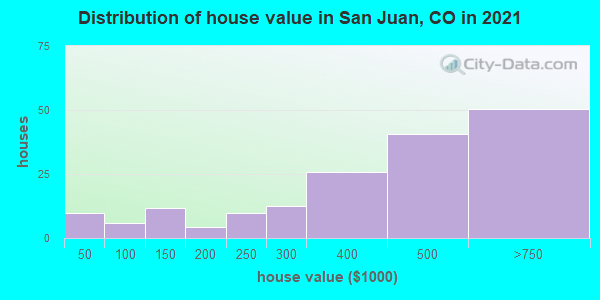
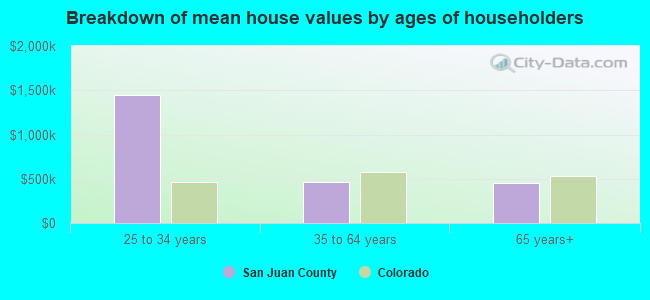
Estimated median house or condo value in 2022: $392,825 (it was $131,900 in 2000)
| San Juan: | $392,825 |
| Colorado: | $531,100 |
Median monthly housing costs for homes and condos with a mortgage: $1,691
Median monthly housing costs for units without a mortgage: $561
Institutionalized population: 0
Crime in 2021 (reported by the sheriff's office or county police, not the county total):
- Murders: 0
- Rapes: 1
- Robberies: 0
- Assaults: 1
- Burglaries: 0
- Thefts: 4
- Auto thefts: 2
Crime in 2020 (reported by the sheriff's office or county police, not the county total):
- Murders: 0
- Rapes: 0
- Robberies: 0
- Assaults: 0
- Burglaries: 0
- Thefts: 4
- Auto thefts: 0
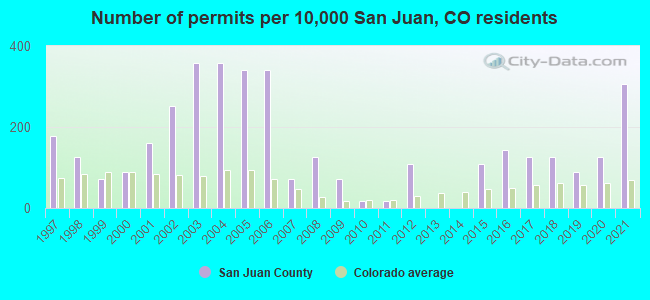
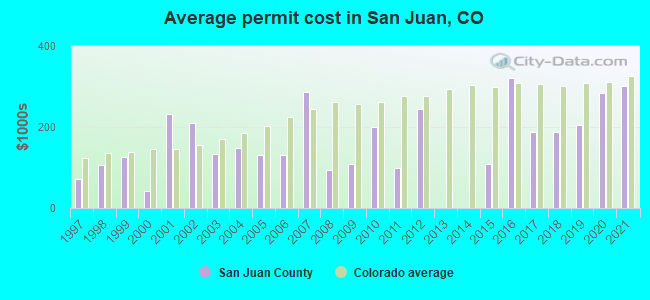
Single-family new house construction building permits:
- 2022: 5 buildings, average cost: $583,300
- 2021: 17 buildings, average cost: $300,000
- 2020: 7 buildings, average cost: $284,100
- 2019: 5 buildings, average cost: $204,600
- 2018: 7 buildings, average cost: $186,700
- 2017: 7 buildings, average cost: $186,700
- 2016: 8 buildings, average cost: $319,900
- 2015: 6 buildings, average cost: $108,300
- 2014: 0 buildings
- 2013: 0 buildings
- 2012: 6 buildings, average cost: $244,000
- 2011: 1 building, cost: $100,000
- 2010: 1 building, cost: $200,000
- 2009: 4 buildings, average cost: $107,700
- 2008: 7 buildings, average cost: $92,800
- 2007: 4 buildings, average cost: $287,100
- 2006: 19 buildings, average cost: $132,400
- 2005: 19 buildings, average cost: $132,400
- 2004: 20 buildings, average cost: $147,200
- 2003: 20 buildings, average cost: $133,600
- 2002: 14 buildings, average cost: $208,600
- 2001: 9 buildings, average cost: $232,400
- 2000: 5 buildings, average cost: $43,000
- 1999: 4 buildings, average cost: $125,900
- 1998: 7 buildings, average cost: $107,200
- 1997: 10 buildings, average cost: $72,300
Median real estate property taxes paid for housing units with mortgages in 2022: $1,086 (0.4%)
Median real estate property taxes paid for housing units with no mortgage in 2022: $822 (0.2%)

| San Juan County: | 18.9% |
| Colorado: | 9.4% |
Median age of residents in 2022: 49.8 years old
(Males: 44.7 years old, Females: 55.1 years old)
(Median age for: White residents: 55.0 years old, Hispanic or Latino residents: 36.1 years old)
Fair market rent in 2006 for a 1-bedroom apartment in San Juan County is $573 a month.
Fair market rent for a 2-bedroom apartment is $663 a month.
Fair market rent for a 3-bedroom apartment is $878 a month.
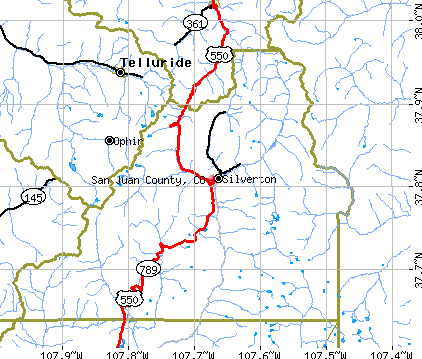
Cities in this county include: Silverton.
Neighboring counties: Bent County  , Cumberland County, Virginia , Harrison County, Indiana , Gray County, Kansas , Mineral County , Buena Vista city, Virginia .
| Here: | 3.2% |
| Colorado: | 3.2% |
Current college students: 14
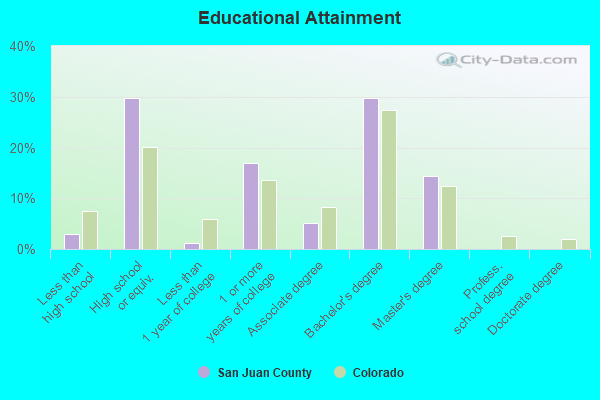
People 25 years of age or older with a high school degree or higher: 95.7%
People 25 years of age or older with a bachelor's degree or higher: 41.7%
Number of foreign born residents: 81 (30.7% naturalized citizens)
| San Juan County: | 11.7% |
| Whole state: | 9.5% |
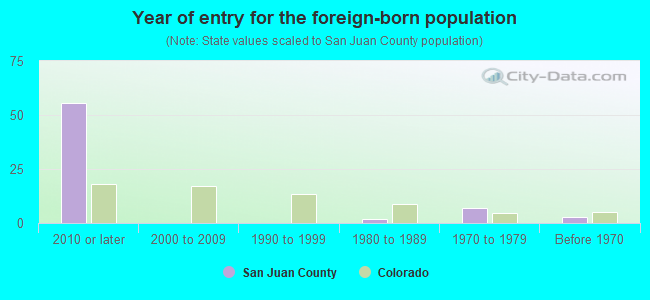
- Year of entry for the foreign-born population
- 652010 or later
- 02000 to 2009
- 01990 to 1999
- 21980 to 1989
- 71970 to 1979
- 3Before 1970
Mean travel time to work (commute): minutes
Percentage of county residents living and working in this county: 100.3%


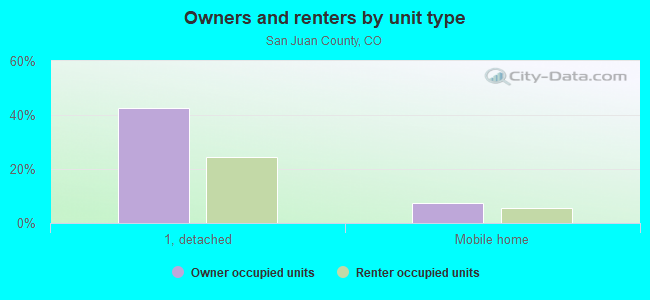
Housing units in structures:
- One, detached: 456
- One, attached: 14
- Two: 23
- 3 or 4: 49
- 5 to 9: 22
- 10 to 19: 22
- 20 to 49: 52
- 50 or more: 47
- Mobile homes: 58
Housing units in San Juan County with a mortgage: 62 (0 second mortgage, 0 home equity loan, 0 both second mortgage and home equity loan)
Houses without a mortgage: 0
| Here: | 100.0% with mortgage |
| State: | 98.2% with mortgage |
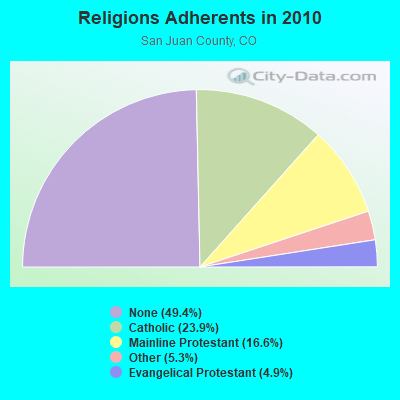
Religion statistics for San Juan County
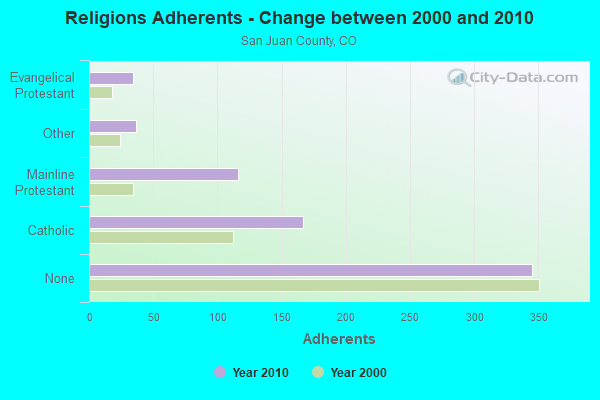
| Religion | Adherents | Congregations |
|---|---|---|
| Catholic | 167 | 2 |
| Mainline Protestant | 116 | 2 |
| Other | 37 | 1 |
| Evangelical Protestant | 34 | 2 |
| None | 345 | - |
Source: Clifford Grammich, Kirk Hadaway, Richard Houseal, Dale E.Jones, Alexei Krindatch, Richie Stanley and Richard H.Taylor. 2012. 2010 U.S.Religion Census: Religious Congregations & Membership Study. Association of Statisticians of American Religious Bodies. Jones, Dale E., et al. 2002. Congregations and Membership in the United States 2000. Nashville, TN: Glenmary Research Center.
Food Environment Statistics:
| San Juan County: | 17.79 / 10,000 pop. |
| Colorado: | 3.13 / 10,000 pop. |
| This county: | 142.35 / 10,000 pop. |
| State: | 8.99 / 10,000 pop. |
| San Juan County: | 5.1% |
| Colorado: | 5.3% |
| San Juan County: | 18.4% |
| State: | 18.4% |
Agriculture in San Juan County:
The value of nursery, greenhouse, floriculture, and sod as a percentage of the total market value of agricultural products sold: 0.00%The value of livestock, poultry, and their products as a percentage of the total market value of agricultural products sold: 0.00%
The percentage of farms operated by a family or individual: 100.00%
Earthquake activity:
San Juan County-area historical earthquake activity is significantly above Colorado state average. It is 1184% greater than the overall U.S. average.On 8/18/1959 at 06:37:13, a magnitude 7.7 (7.7 UK, Class: Major, Intensity: VIII - XII) earthquake occurred 492.3 miles away from San Juan County center, causing $26,000,000 total damage
On 6/28/1992 at 11:57:34, a magnitude 7.6 (6.2 MB, 7.6 MS, 7.3 MW, Depth: 0.7 mi) earthquake occurred 555.1 miles away from the county center, causing 3 deaths (1 shaking deaths, 2 other deaths) and 400 injuries, causing $100,000,000 total damage and $40,000,000 insured losses
On 10/3/1915 at 06:52:48, a magnitude 7.6 (7.6 UK) earthquake occurred 558.5 miles away from the county center
On 10/16/1999 at 09:46:44, a magnitude 7.4 (6.3 MB, 7.4 MS, 7.2 MW, 7.3 ML) earthquake occurred 539.3 miles away from the county center
On 8/23/2011 at 05:46:18, a magnitude 5.3 (5.3 MW, Depth: 2.5 mi, Class: Moderate, Intensity: VI - VII) earthquake occurred 171.3 miles away from San Juan County center
On 9/13/1994 at 06:01:23, a magnitude 4.6 (4.4 MB, 4.6 ML, Depth: 6.2 mi, Class: Light, Intensity: IV - V) earthquake occurred 28.8 miles away from the county center
Magnitude types: body-wave magnitude (MB), local magnitude (ML), surface-wave magnitude (MS), moment magnitude (MW)
Most recent natural disasters:
- Colorado Covid-19 Pandemic, Incident Period: January 20, 2020, FEMA Id: 4498, Natural disaster type: Other
- Colorado Hurricane Katrina Evacuation, Incident Period: August 29, 2005 to October 01, 2005, Emergency Declared EM-3224: September 05, 2005, FEMA Id: 3224, Natural disaster type: Hurricane
- Colorado Wildfires, Incident Period: April 23, 2002 to August 06, 2002, Major Disaster (Presidential) Declared DR-1421: June 19, 2002, FEMA Id: 1421, Natural disaster type: Fire
- Colorado FLOODING, LANDSLIDES, Incident Period: July 06, 1973, Major Disaster (Presidential) Declared DR-396: July 06, 1973, FEMA Id: 396, Natural disaster type: Landslide, Flood
- Colorado Heavy Rains, Flooding, Incident Period: September 22, 1970, Major Disaster (Presidential) Declared DR-293: September 22, 1970, FEMA Id: 293, Natural disaster type: Flood, Heavy Rain
The number of natural disasters in San Juan County (5) is a lot smaller than the US average (15).
Major Disasters (Presidential) Declared: 3
Emergencies Declared: 1
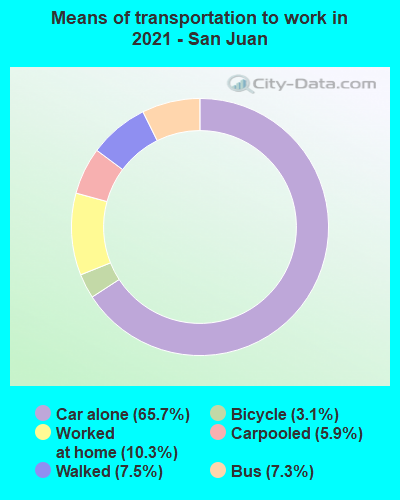
Means of transportation to work:
- Drove a car alone: 346 (61.3%)
- Carpooled: 36 (6.4%)
- Bus: 36 (6.4%)
- Bicycle: 12 (2.1%)
- Walked: 30 (5.3%)
- Worked at home: 81 (14.4%)
- Accommodation and food services (13%)
- Educational services (12%)
- Retail trade (11%)
- Other services, except public administration (8%)
- Real estate and rental and leasing (6%)
- Public administration (5%)
- Health care and social assistance (3%)
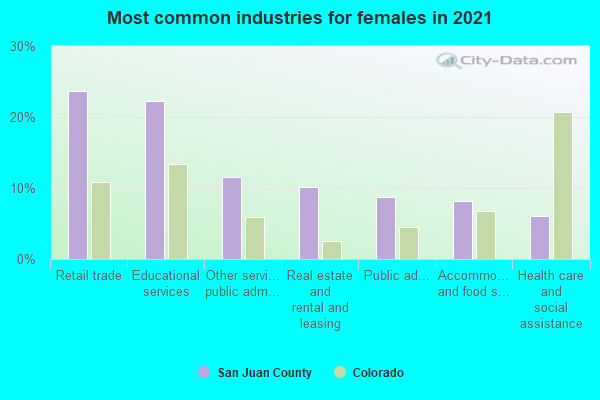
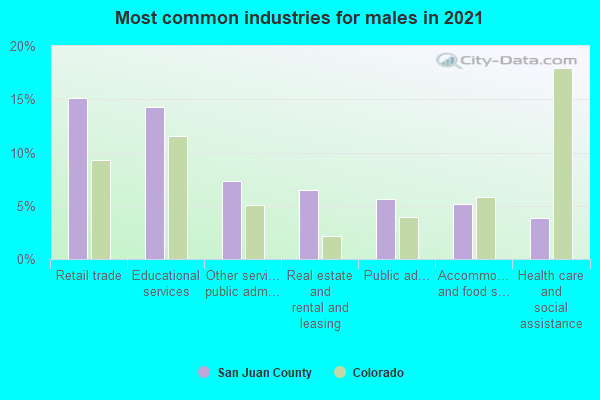
- Accommodation and food services (19%)
- Educational services (18%)
- Retail trade (16%)
- Other services, except public administration (12%)
- Real estate and rental and leasing (9%)
- Public administration (7%)
- Health care and social assistance (4%)
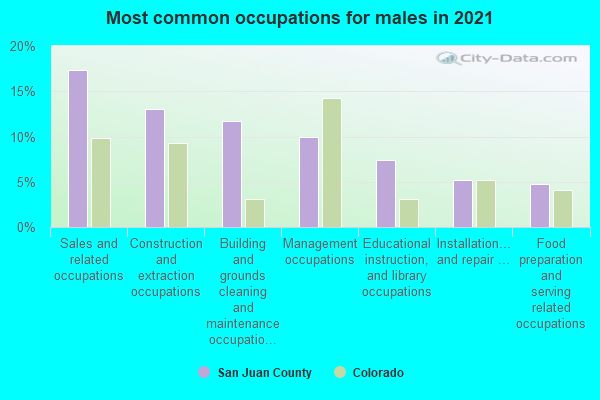
- Sales and related occupations (17%)
- Educational instruction, and library occupations (13%)
- Management occupations (12%)
- Building and grounds cleaning and maintenance occupations (11%)
- Construction and extraction occupations (10%)
- Food preparation and serving related occupations (8%)
- Installation, maintenance, and repair occupations (5%)
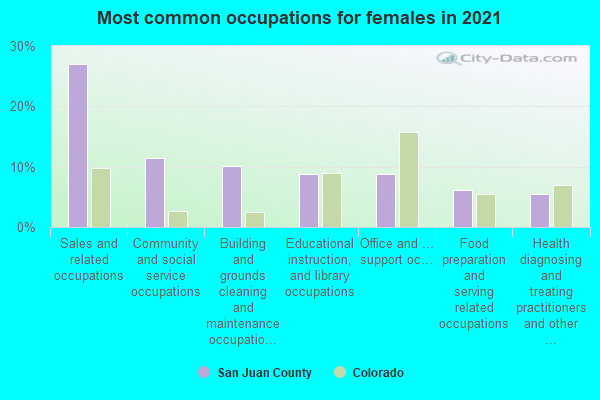
- Sales and related occupations (24%)
- Building and grounds cleaning and maintenance occupations (15%)
- Educational instruction, and library occupations (10%)
- Food preparation and serving related occupations (9%)
- Community and social service occupations (9%)
- Management occupations (6%)
- Office and administrative support occupations (6%)
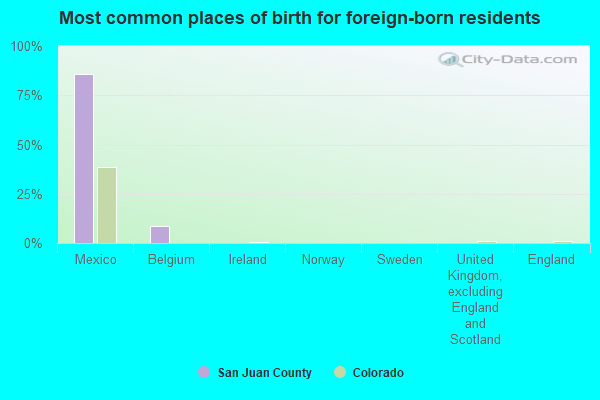
- Mexico (99%)
- Ireland (0%)
- Norway (0%)
- Sweden (0%)
- United Kingdom, excluding England and Scotland (0%)
- England (0%)
- Scotland (0%)
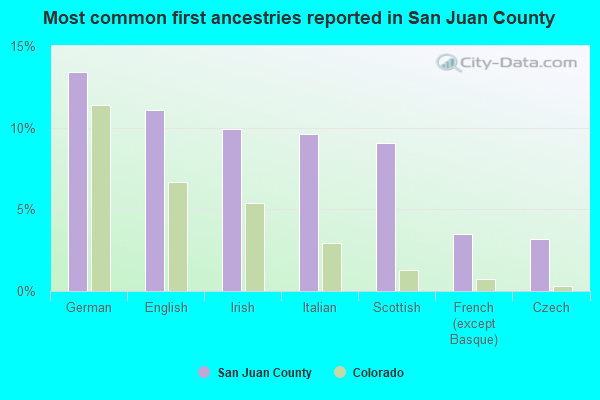
- German (14%)
- Scottish (10%)
- Italian (10%)
- Irish (7%)
- English (5%)
- Czech (4%)
- American (3%)
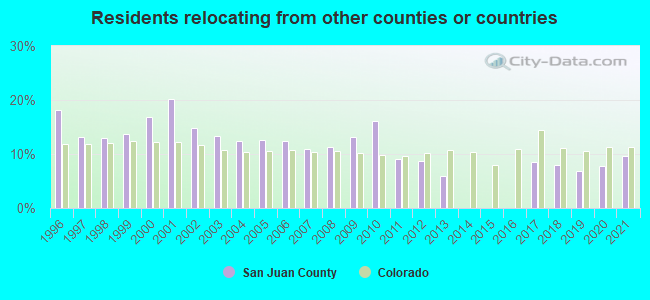
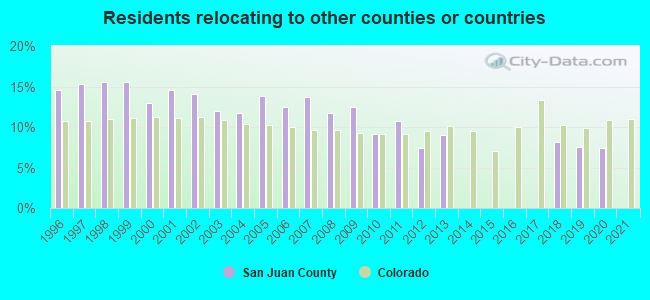
9.57% of this county's 2021 resident taxpayers lived in other counties in 2020 ($34,323 average adjusted gross income)
| Here: | 9.57% |
| Colorado average: | 11.28% |
10 or fewer of this county's residents moved from foreign countries.
9.57% relocated from other counties in Colorado ($34,323 average AGI)
10 or fewer of this county's residents relocated from other states.
10 or fewer of this county's residents relocated to other counties between 2020 and 2021.1,000 average adjusted gross income)
10 or fewer of this county's residents moved to foreign countries.
10 or fewer of this county's residents relocated to other counties in Colorado.
10 or fewer of this county's residents relocated to other states.
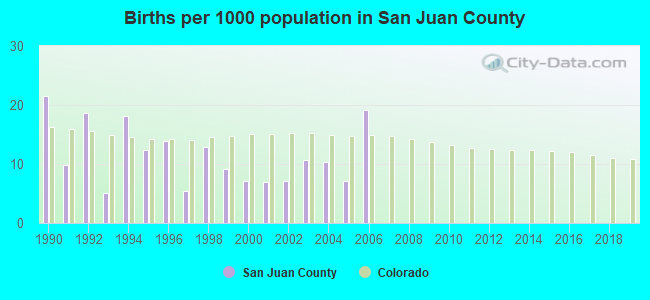
Births per 1000 population from 1990 to 1999: 12.7
Births per 1000 population from 2000 to 2006: 9.8
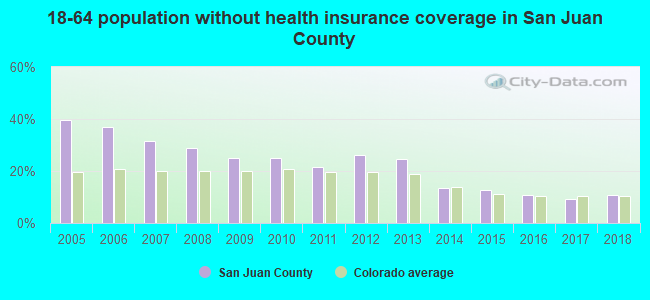
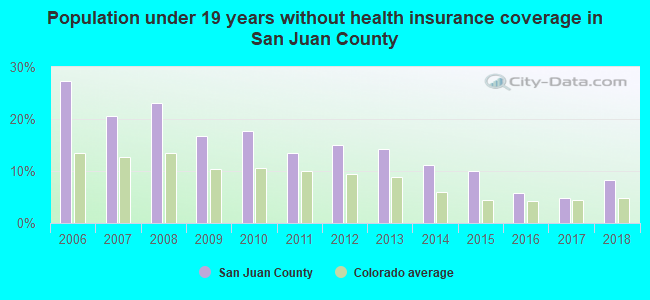
Persons under 19 years old without health insurance coverage in 2018: 8.2%

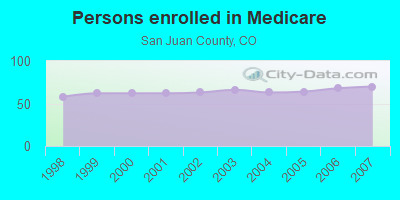
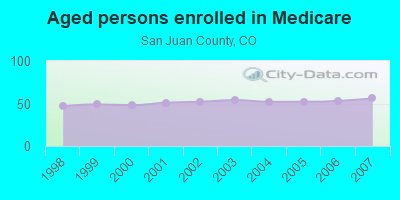
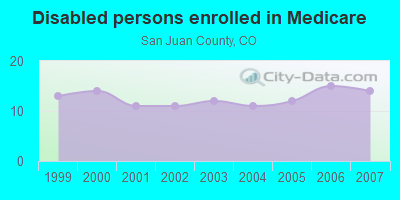
Persons enrolled in hospital insurance and/or supplemental medical insurance (Medicare) in July 1, 2007: 70 (56 aged, 14 disabled)
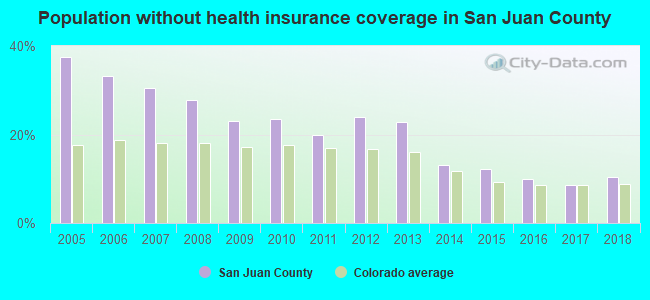
Children under 18 without health insurance coverage in 2007: 24 (24%)
Population without health insurance coverage in 2000: 27%
Children under 18 without health insurance coverage in 2000: 26%
Household type by relationship:
Households: 698- Male householders: 219 (62 living alone), Female householders: 132 (25 living alone)
175 spouses (175 opposite-sex spouses), 50 unmarried partners, (40 opposite-sex unmarried partners), 80 children (80 natural, 0 adopted, 0 stepchildren), 15 grandchildren, 1 brothers or sisters, 2 parents, 0 foster children, 4 other relatives, 26 non-relatives
Size of family households: 167 2-persons, 14 3-persons, 25 4-persons, 5 5-persons.
Size of nonfamily households: 88 1-person, 45 2-persons, 9 3-persons.
60 married couples with children.
14 single-parent households (0 men, 14 women).
81.0% of residents of San Juan speak English at home.
17.3% of residents speak Spanish at home (64% speak English very well, 9% speak English well, 27% speak English not well).
1.5% of residents speak other Indo-European language at home (100% speak English very well).
In fiscal year 2004:
Federal Government expenditure: $2,067,000 ($3,595 per capita)
Department of Defense expenditure: $63,000
Federal direct payments to individuals for retirement and disability: $1,171,000
Federal other direct payments to individuals: $305,000
Federal direct payments not to individuals: $0,000
Federal grants: $349,000
Federal procurement contracts: $115,000 ($0,000 Department of Defense)
Federal salaries and wages: $126,000 ($0,000 Department of Defense)
Federal Government direct loans: $275,000
Federal guaranteed/insured loans: $110,000
Federal Government insurance: $402,000
Population change from April 1, 2000 to July 1, 2005:
Births: 26| Here: | 45 per 1000 residents |
| State: | 76 per 1000 residents |
Deaths: 10
| Here: | 17 per 1000 residents |
| State: | 32 per 1000 residents |
Net international migration: -4
| Here: | |
| State: |
Net internal migration: +8
| Here: | +14 per 1000 residents |
| State: | +10 per 1000 residents |
Total withdrawal of fresh water for public supply: 0.16 millions of gallons per day (6% from ground, 94% from surface)
| Here: | 5.6 |
| State: | 6.8 |
| Here: | 5.1 |
| State: | 4.0 |
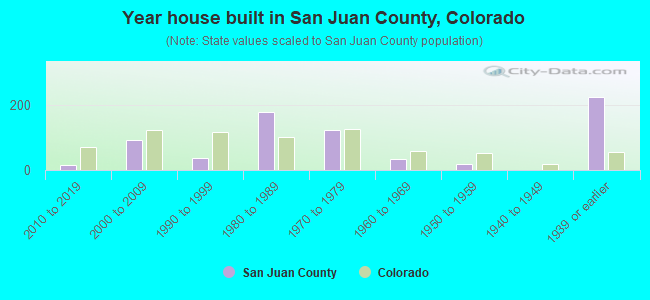
- Year house built in San Juan County, Colorado
- 202020 or later
- 152010 to 2019
- 782000 to 2009
- 361990 to 1999
- 1721980 to 1989
- 1321970 to 1979
- 231960 to 1969
- 71950 to 1959
- 01940 to 1949
- 2421939 or earlier
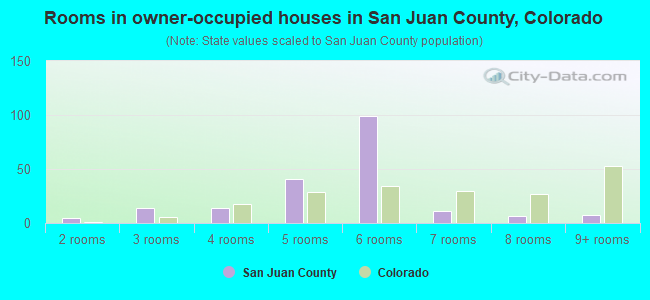
- Rooms in owner-occupied houses in San Juan County, Colorado
- 01 room
- 52 rooms
- 253 rooms
- 84 rooms
- 465 rooms
- 856 rooms
- 167 rooms
- 68 rooms
- 39+ rooms
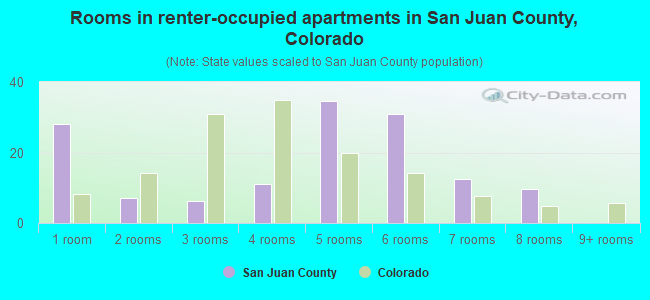
- Rooms in renter-occupied apartments in San Juan County, Colorado
- 281 room
- 42 rooms
- 73 rooms
- 184 rooms
- 355 rooms
- 346 rooms
- 217 rooms
- 108 rooms
- 09+ rooms
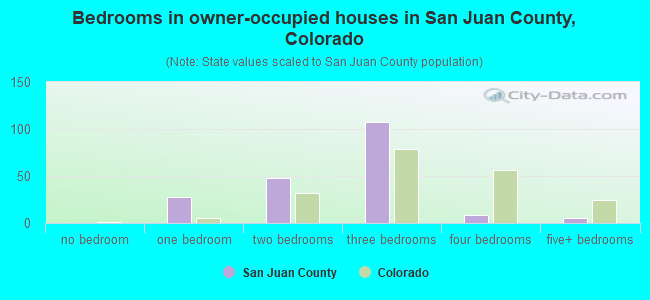
- Bedrooms in owner-occupied houses in San Juan County, Colorado
- 0no bedroom
- 421 bedroom
- 402 bedrooms
- 1063 bedrooms
- 84 bedrooms
- 05+ bedrooms
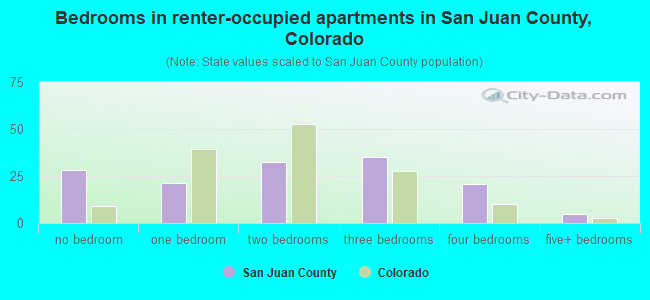
- Bedrooms in renter-occupied apartments in San Juan County, Colorado
- 29no bedroom
- 301 bedroom
- 382 bedrooms
- 313 bedrooms
- 284 bedrooms
- 55+ bedrooms
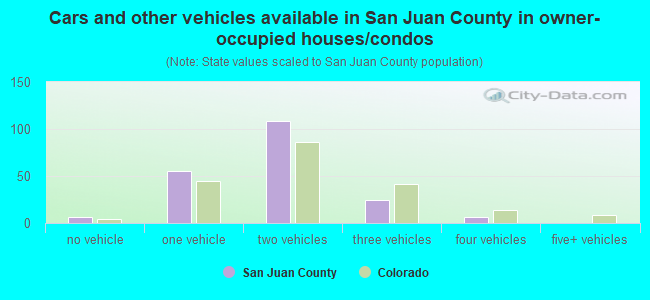
- Cars and other vehicles available in San Juan County in owner-occupied houses/condos
- 7no vehicle
- 491 vehicle
- 1132 vehicles
- 183 vehicles
- 94 vehicles
- 05+ vehicles
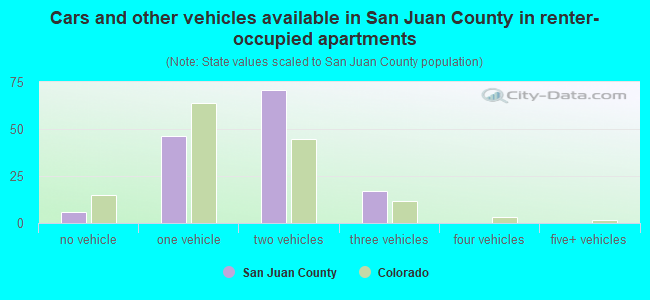
- Cars and other vehicles available in San Juan County in renter-occupied apartments
- 7no vehicle
- 491 vehicle
- 772 vehicles
- 253 vehicles
- 04 vehicles
- 05+ vehicles
92.3% of San Juan County residents lived in the same house 1 years ago.
Out of people who lived in different houses, 5% lived in this county.
Out of people who lived in different counties, 57% lived in Colorado.
| San Juan County: | 92.3% |
| State average: | 83.6% |
Place of birth for U.S.-born residents:
- This state: 193
- Other state: 411
- Northeast: 73
- Midwest: 112
- South: 119
- West: 105
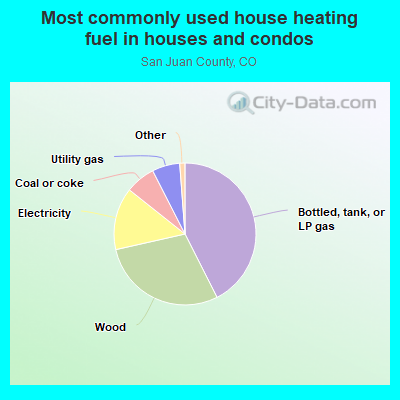
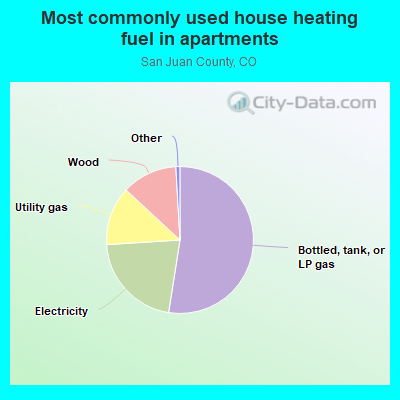
- 38.9%Bottled, tank, or LP gas
- 28.6%Wood
- 16.2%Electricity
- 12.4%Utility gas
- 3.8%Coal or coke
- 40.8%Bottled, tank, or LP gas
- 23.0%Wood
- 20.4%Electricity
- 15.8%Utility gas
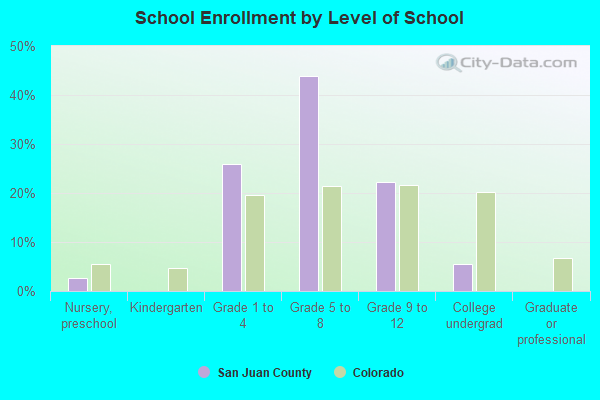
Private vs. public school enrollment:
| Here: | 0.0% |
| Colorado: | 11.4% |
| Here: | 0.0% |
| Colorado: | 8.5% |
| Here: | 0.0% |
| Colorado: | 14.0% |
San Juan County government finances - Expenditure in 2018:
- Assistance and Subsidies - Public Welfare, Federal Categorical Assistance Programs: $127,000
- Current Operations - Central Staff Services: $391,000
Regular Highways: $371,000
Police Protection: $366,000
Financial Administration: $195,000
Health - Other: $108,000
General Public Buildings: $80,000
Judicial and Legal Services: $26,000
- Federal Intergovernmental - General Local Government Support: $88,000
- General - Interest on Debt: $2,629,000
- Intergovernmental to Local - Other - Local Fire Protection: $307,000
Other - Health - Other: $5,000
- Long Term Debt - Beginning Outstanding - Unspecified Public Purpose: $65,730,000
Outstanding Unspecified Public Purpose: $65,730,000
- Miscellaneous - Interest Earnings: $8,000
Rents: $7,000
- Other Capital Outlay - Regular Highways: $156,000
- Other Funds - Cash and Securities: $2,587,000
- State Intergovernmental - Highways: $350,000
Other: $184,000
Health and Hospitals: $119,000
- Tax - Property: $821,000
General Sales and Gross Receipts: $157,000
Alcoholic Beverage License: $1,000
San Juan County government finances - Revenue in 2018:
- Assistance and Subsidies - Public Welfare, Federal Categorical Assistance Programs: $127,000
- Current Operations - Central Staff Services: $391,000
Regular Highways: $371,000
Police Protection: $366,000
Financial Administration: $195,000
Health - Other: $108,000
General Public Buildings: $80,000
Judicial and Legal Services: $26,000
- Federal Intergovernmental - General Local Government Support: $88,000
- General - Interest on Debt: $2,629,000
- Intergovernmental to Local - Other - Local Fire Protection: $307,000
Other - Health - Other: $5,000
- Long Term Debt - Beginning Outstanding - Unspecified Public Purpose: $65,730,000
Outstanding Unspecified Public Purpose: $65,730,000
- Miscellaneous - Interest Earnings: $8,000
Rents: $7,000
- Other Capital Outlay - Regular Highways: $156,000
- Other Funds - Cash and Securities: $2,587,000
- State Intergovernmental - Highways: $350,000
Other: $184,000
Health and Hospitals: $119,000
- Tax - Property: $821,000
General Sales and Gross Receipts: $157,000
Alcoholic Beverage License: $1,000
San Juan County government finances - Debt in 2018:
- Assistance and Subsidies - Public Welfare, Federal Categorical Assistance Programs: $127,000
- Current Operations - Central Staff Services: $391,000
Regular Highways: $371,000
Police Protection: $366,000
Financial Administration: $195,000
Health - Other: $108,000
General Public Buildings: $80,000
Judicial and Legal Services: $26,000
- Federal Intergovernmental - General Local Government Support: $88,000
- General - Interest on Debt: $2,629,000
- Intergovernmental to Local - Other - Local Fire Protection: $307,000
Other - Health - Other: $5,000
- Long Term Debt - Beginning Outstanding - Unspecified Public Purpose: $65,730,000
Outstanding Unspecified Public Purpose: $65,730,000
- Miscellaneous - Interest Earnings: $8,000
Rents: $7,000
- Other Capital Outlay - Regular Highways: $156,000
- Other Funds - Cash and Securities: $2,587,000
- State Intergovernmental - Highways: $350,000
Other: $184,000
Health and Hospitals: $119,000
- Tax - Property: $821,000
General Sales and Gross Receipts: $157,000
Alcoholic Beverage License: $1,000
San Juan County government finances - Cash and Securities in 2018:
- Assistance and Subsidies - Public Welfare, Federal Categorical Assistance Programs: $127,000
- Current Operations - Central Staff Services: $391,000
Regular Highways: $371,000
Police Protection: $366,000
Financial Administration: $195,000
Health - Other: $108,000
General Public Buildings: $80,000
Judicial and Legal Services: $26,000
- Federal Intergovernmental - General Local Government Support: $88,000
- General - Interest on Debt: $2,629,000
- Intergovernmental to Local - Other - Local Fire Protection: $307,000
Other - Health - Other: $5,000
- Long Term Debt - Beginning Outstanding - Unspecified Public Purpose: $65,730,000
Outstanding Unspecified Public Purpose: $65,730,000
- Miscellaneous - Interest Earnings: $8,000
Rents: $7,000
- Other Capital Outlay - Regular Highways: $156,000
- Other Funds - Cash and Securities: $2,587,000
- State Intergovernmental - Highways: $350,000
Other: $184,000
Health and Hospitals: $119,000
- Tax - Property: $821,000
General Sales and Gross Receipts: $157,000
Alcoholic Beverage License: $1,000
Supplemental Security Income (SSI) in 2006:
- Total number of recipients: 3
- Number of aged recipients: 0
- Number of blind and disabled recipients: 0
- Number of recipients under 18: 0
- Number of recipients between 18 and 64: 0
- Number of recipients older than 64: 0
- Number of recipients also receiving OASDI: 0
- Amount of payments (thousands of dollars): 0
| Most common first names in San Juan County, CO among deceased individuals | ||
| Name | Count | Lived (average) |
|---|---|---|
| Mary | 7 | 83.0 years |
| Charles | 4 | 68.0 years |
| James | 4 | 53.8 years |
| Joe | 4 | 60.8 years |
| William | 4 | 70.5 years |
| Barbara | 2 | 53.0 years |
| Jesse | 2 | 73.5 years |
| John | 2 | 79.5 years |
| Nancy | 2 | 70.0 years |
| Norman | 2 | 83.0 years |
| Most common last names in San Juan County, CO among deceased individuals | ||
| Last name | Count | Lived (average) |
|---|---|---|
| Hill | 3 | 83.0 years |
| Salazar | 3 | 57.0 years |
| Dalla | 2 | 76.5 years |
| Andreatta | 2 | 71.0 years |
| Cole | 2 | 62.5 years |
| Donnelly | 2 | 59.5 years |
| Crawford | 2 | 69.6 years |
| Gallegos | 2 | 65.5 years |
| Dailey | 2 | 67.1 years |
| Blackmore | 2 | 59.9 years |
Businesses in San Juan County, CO
- FedEx: 1
San Juan County on our top lists:
- #2 on the list of "Top 101 counties with the lowest ground withdrawal of fresh water for public supply"
- #9 on the list of "Top 101 counties with highest percentage of residents voting for 3rd party candidates in the 2012 Presidential Election"