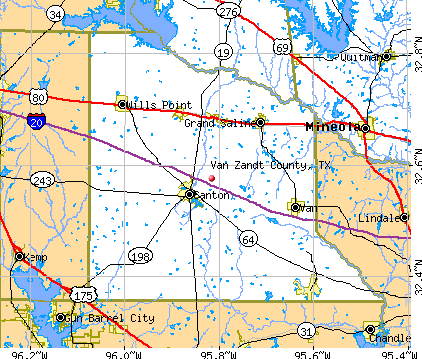
Van Zandt County, Texas (TX)
County owner-occupied free and clear houses and condos in 2010: 7,595
County owner-occupied houses and condos in 2000: 14,713
Renter-occupied apartments: 4,370 (it was 3,482 in 2000)
| % of renters here: | 19% |
| State: | 36% |
Land area: 849 sq. mi.
Water area: 10.8 sq. mi.
Population density: 73 people per square mile (average).
Industries providing employment: Educational, health and social services (20.3%), Manufacturing (12.7%), Retail trade (12.5%).
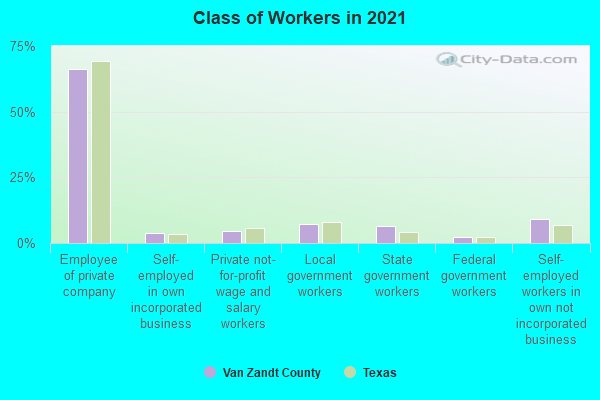
Type of workers:
- Private wage or salary: 76%
- Government: 15%
- Self-employed, not incorporated: 8%
- Unpaid family work: 0%
- OSM Map
- General Map
- Google Map
- MSN Map

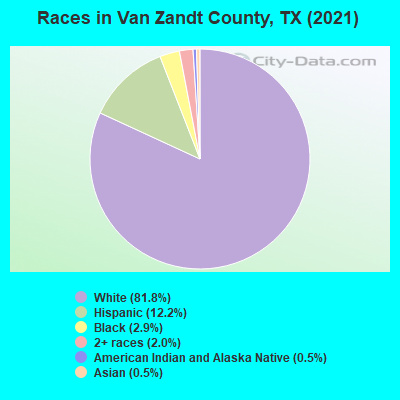
- 49,05581.1%White Non-Hispanic Alone
- 7,69812.7%Hispanic or Latino
- 1,6952.8%Black Non-Hispanic Alone
- 1,3912.3%Two or more races
- 3130.5%Asian alone
- 2130.4%American Indian and Alaska Native alone
- 950.2%Some other race alone
- 160.03%Native Hawaiian and Other
Pacific Islander alone
| Median resident age: | 42.5 years |
| Texas median age: | 35.6 years |
| Males: 30,405 | |
| Females: 31,262 |


| Van Zandt County: | 2.0 people |
| Texas: | 3 people |
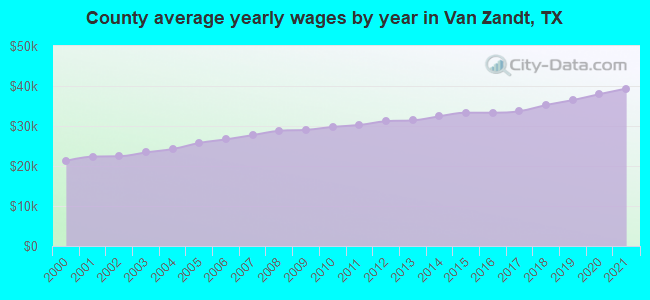
Estimated median household income in 2022: $61,693 ($35,029 in 1999)
| This county: | $61,693 |
| Texas: | $72,284 |
Median contract rent in 2022 for apartments: $753 (lower quartile is $580, upper quartile is $958)
| This county: | $753 |
| State: | $1117 |
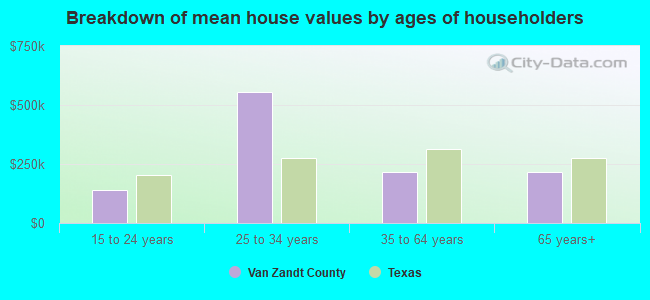
Estimated median house or condo value in 2022: $209,790 (it was $66,700 in 2000)
| Van Zandt: | $209,790 |
| Texas: | $275,400 |
Mean price in 2022:
Median monthly housing costs for homes and condos with a mortgage: $1,461Detached houses: $382,607
Here: $382,607 State: $369,058 Townhouses or other attached units: $251,304
Here: $251,304 State: $327,631 Mobile homes: $152,771
Here: $152,771 State: $124,413 Occupied boats, RVs, vans, etc.: $14,845
Here: $14,845 State: $73,921
Median monthly housing costs for units without a mortgage: $552
Institutionalized population: 648
Crime in 2021 (reported by the sheriff's office or county police, not the county total):
- Murders: 3
- Rapes: 7
- Robberies: 3
- Assaults: 49
- Burglaries: 122
- Thefts: 87
- Auto thefts: 19
Crime in 2020 (reported by the sheriff's office or county police, not the county total):
- Murders: 0
- Rapes: 11
- Robberies: 1
- Assaults: 57
- Burglaries: 44
- Thefts: 75
- Auto thefts: 27
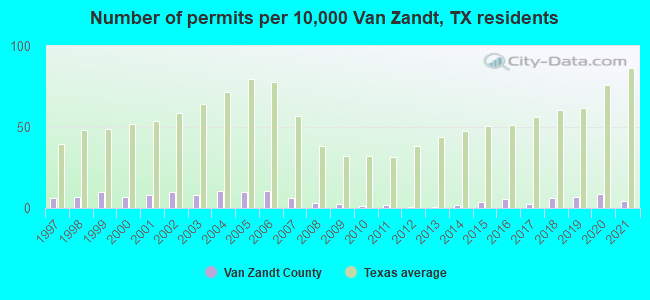
Single-family new house construction building permits:
- 2022: 34 buildings, average cost: $281,700
- 2021: 22 buildings, average cost: $217,600
- 2020: 42 buildings, average cost: $182,200
- 2019: 32 buildings, average cost: $198,600
- 2018: 31 buildings, average cost: $140,300
- 2017: 13 buildings, average cost: $155,500
- 2016: 28 buildings, average cost: $166,200
- 2015: 17 buildings, average cost: $138,500
- 2014: 9 buildings, average cost: $130,000
- 2013: 3 buildings, average cost: $110,000
- 2012: 4 buildings, average cost: $95,000
- 2011: 9 buildings, average cost: $277,800
- 2010: 5 buildings, average cost: $112,900
- 2009: 13 buildings, average cost: $101,100
- 2008: 14 buildings, average cost: $105,600
- 2007: 29 buildings, average cost: $113,800
- 2006: 50 buildings, average cost: $93,300
- 2005: 47 buildings, average cost: $131,700
- 2004: 51 buildings, average cost: $92,600
- 2003: 40 buildings, average cost: $89,900
- 2002: 49 buildings, average cost: $84,300
- 2001: 39 buildings, average cost: $88,200
- 2000: 32 buildings, average cost: $120,800
- 1999: 48 buildings, average cost: $100,900
- 1998: 32 buildings, average cost: $72,700
- 1997: 29 buildings, average cost: $61,000
Median real estate property taxes paid for housing units with mortgages in 2022: $2,771 (1.2%)
Median real estate property taxes paid for housing units with no mortgage in 2022: $1,815 (0.9%)
| Van Zandt County: | 13.2% |
| Texas: | 14.0% |
Median age of residents in 2022: 42.5 years old
(Males: 41.6 years old, Females: 43.4 years old)
(Median age for: White residents: 45.8 years old, Black residents: 35.4 years old, American Indian residents: 44.9 years old, Asian residents: 33.2 years old, Hispanic or Latino residents: 26.8 years old, Other race residents: 30.0 years old)
Fair market rent in 2006 for a 1-bedroom apartment in Van Zandt County is $429 a month.
Fair market rent for a 2-bedroom apartment is $525 a month.
Fair market rent for a 3-bedroom apartment is $734 a month.
Cities in this county include: Ben Wheeler-Edom, Wills Point, Canton, Grand Saline, Van, Edgewood, Callender Lake, Myrtle Springs, Fruitvale, Edom.
Neighboring counties: Bibb County, Alabama  , Issaquena County, Mississippi , Ouachita Parish, Louisiana , Glascock County, Georgia , Erath County
  , Kaufman County .
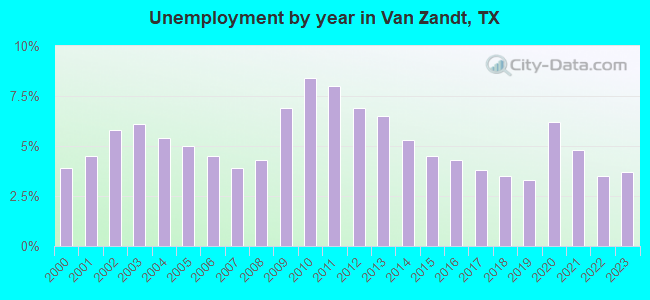
| Here: | 3.1% |
| Texas: | 3.5% |
Current college students: 1,205
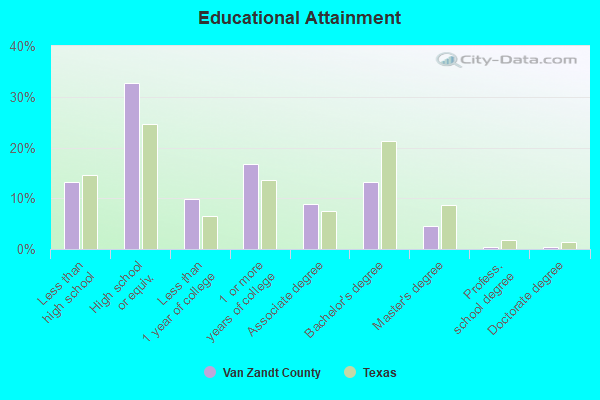
People 25 years of age or older with a high school degree or higher: 86.0%
People 25 years of age or older with a bachelor's degree or higher: 17.1%
Number of foreign born residents: 2,311 (41.1% naturalized citizens)
| Van Zandt County: | 3.7% |
| Whole state: | 17.2% |
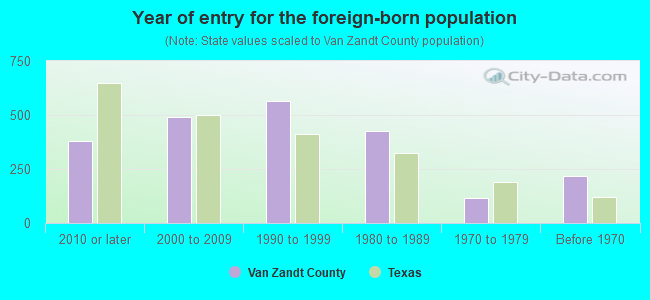
- Year of entry for the foreign-born population
- 3632010 or later
- 5022000 to 2009
- 7491990 to 1999
- 4251980 to 1989
- 1151970 to 1979
- 219Before 1970
Mean travel time to work (commute): % minutes
Percentage of county residents living and working in this county: 98.9%
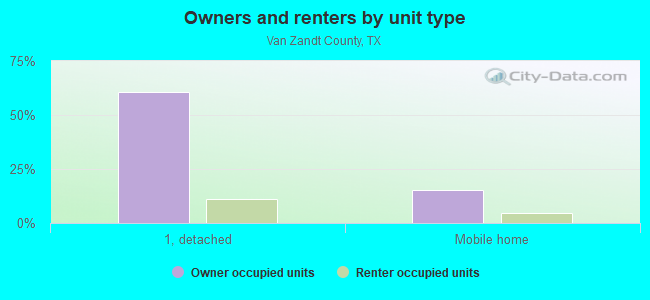
Housing units in structures:
- One, detached: 19,511
- One, attached: 216
- Two: 398
- 3 or 4: 381
- 5 to 9: 98
- 10 to 19: 84
- 20 to 49: 136
- 50 or more: 22
- Mobile homes: 5,150
- Boats, RVs, vans, etc.: 259
Housing units in Van Zandt County with a mortgage: 8,013 (147 second mortgage, 0 home equity loan, 136 both second mortgage and home equity loan)
Houses without a mortgage: 89
| Here: | 8.2% with mortgage |
| State: | 98.4% with mortgage |
Religion statistics for Van Zandt County
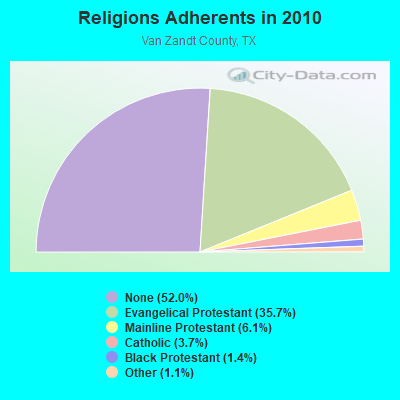
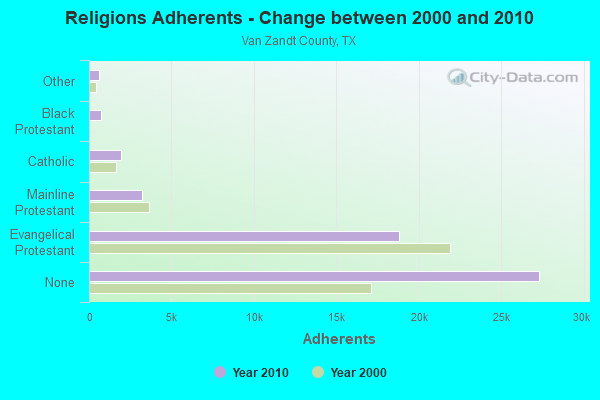
| Religion | Adherents | Congregations |
|---|---|---|
| Evangelical Protestant | 18,791 | 85 |
| Mainline Protestant | 3,231 | 15 |
| Catholic | 1,945 | 3 |
| Black Protestant | 715 | 5 |
| Other | 578 | 2 |
| None | 27,319 | - |
Source: Clifford Grammich, Kirk Hadaway, Richard Houseal, Dale E.Jones, Alexei Krindatch, Richie Stanley and Richard H.Taylor. 2012. 2010 U.S.Religion Census: Religious Congregations & Membership Study. Association of Statisticians of American Religious Bodies. Jones, Dale E., et al. 2002. Congregations and Membership in the United States 2000. Nashville, TN: Glenmary Research Center.
Food Environment Statistics:
| Van Zandt County: | 1.16 / 10,000 pop. |
| State: | 1.47 / 10,000 pop. |
| Here: | 0.19 / 10,000 pop. |
| Texas: | 0.14 / 10,000 pop. |
| This county: | 1.16 / 10,000 pop. |
| Texas: | 1.11 / 10,000 pop. |
| Van Zandt County: | 6.18 / 10,000 pop. |
| Texas: | 3.95 / 10,000 pop. |
| This county: | 5.60 / 10,000 pop. |
| State: | 6.13 / 10,000 pop. |
| Van Zandt County: | 8.9% |
| Texas: | 8.9% |
| Van Zandt County: | 25.5% |
| State: | 26.6% |
| Here: | 14.9% |
| State: | 15.7% |
Agriculture in Van Zandt County:
Average size of farms: 149 acresAverage value of agricultural products sold per farm: $25,696
Average value of crops sold per acre for harvested cropland: $422.44
The value of nursery, greenhouse, floriculture, and sod as a percentage of the total market value of agricultural products sold: 35.34%
The value of livestock, poultry, and their products as a percentage of the total market value of agricultural products sold: 54.50%
Average total farm production expenses per farm: $24,729
Harvested cropland as a percentage of land in farms: 18.63%
Irrigated harvested cropland as a percentage of land in farms: 4.33%
Average market value of all machinery and equipment per farm: $37,113
The percentage of farms operated by a family or individual: 96.24%
Average age of principal farm operators: 57 years
Average number of cattle and calves per 100 acres of all land in farms: 26.92
Milk cows as a percentage of all cattle and calves: 7.50%
All wheat for grain: 114 harvested acres
Vegetables: 1,338 harvested acres
Land in orchards: 469 acres
Earthquake activity:
Van Zandt County-area historical earthquake activity is significantly above Texas state average. It is 423% greater than the overall U.S. average.On 11/6/2011 at 03:53:10, a magnitude 5.7 (5.7 MW, Depth: 3.2 mi, Class: Moderate, Intensity: VI - VII) earthquake occurred 211.7 miles away from Van Zandt County center
On 9/3/2016 at 12:02:44, a magnitude 5.8 (5.8 MW, Depth: 3.5 mi) earthquake occurred 273.8 miles away from the county center
On 5/17/2012 at 08:12:00, a magnitude 4.8 (4.8 MW, Depth: 3.1 mi, Class: Light, Intensity: IV - V) earthquake occurred 95.9 miles away from the county center
On 9/2/2013 at 23:51:15, a magnitude 4.3 (4.3 MW, Depth: 2.9 mi) earthquake occurred 93.4 miles away from the county center
On 6/16/1978 at 11:46:54, a magnitude 5.3 (4.4 MB, 4.6 UK, 5.3 ML) earthquake occurred 289.4 miles away from Van Zandt County center
On 11/7/2016 at 01:44:24, a magnitude 5.0 (5.0 MW, Depth: 2.8 mi) earthquake occurred 242.9 miles away from the county center
Magnitude types: body-wave magnitude (MB), local magnitude (ML), moment magnitude (MW)
Most recent natural disasters:
- Texas Covid-19 Pandemic, Incident Period: January 20, 2020, FEMA Id: 4485, Natural disaster type: Other
- Texas Severe Winter Storms, Tornadoes, Straight-line Winds, and Flooding, Incident Period: December 26, 2016 to January 21, 2016, Major Disaster (Presidential) Declared DR-4255: February 09, 2016, FEMA Id: 4255, Natural disaster type: Winter Storm, Tornado, Flood, Wind
- Texas Severe Storms and Flooding, Incident Period: April 17, 2016 to April 30, 2016, Major Disaster (Presidential) Declared DR-4269: April 25, 2016, FEMA Id: 4269, Natural disaster type: Storm, Flood
- Texas Severe Storms, Tornadoes, Straight-line Winds, and Flooding, Incident Period: May 04, 2015 to June 23, 2015, Major Disaster (Presidential) Declared DR-4223: May 29, 2015, FEMA Id: 4223, Natural disaster type: Storm, Tornado, Flood, Wind
- Texas Hurricane Ike, Incident Period: September 07, 2008 to September 26, 2008, Emergency Declared EM-3294: September 10, 2008, FEMA Id: 3294, Natural disaster type: Hurricane
- Texas Wildfires, Incident Period: March 14, 2008 to September 01, 2008, Emergency Declared EM-3284: March 14, 2008, FEMA Id: 3284, Natural disaster type: Fire
- Texas Severe Storms, Tornadoes, and Flooding, Incident Period: June 16, 2007 to August 03, 2007, Major Disaster (Presidential) Declared DR-1709: June 29, 2007, FEMA Id: 1709, Natural disaster type: Storm, Tornado, Flood
- Texas Hurricane Rita, Incident Period: September 23, 2005 to October 14, 2005, Major Disaster (Presidential) Declared DR-1606: September 24, 2005, FEMA Id: 1606, Natural disaster type: Hurricane
- Texas Hurricane Rita, Incident Period: September 20, 2005 to October 14, 2005, Emergency Declared EM-3261: September 21, 2005, FEMA Id: 3261, Natural disaster type: Hurricane
- Texas Hurricane Katrina, Incident Period: August 29, 2005 to October 01, 2005, Emergency Declared EM-3216: September 02, 2005, FEMA Id: 3216, Natural disaster type: Hurricane
- 4 other natural disasters have been reported since 1953.
The number of natural disasters in Van Zandt County (14) is near the US average (15).
Major Disasters (Presidential) Declared: 7
Emergencies Declared: 6
Causes of natural disasters: Floods: 6, Storms: 5, Tornadoes: 5, Hurricanes: 4, Fires: 3, Winds: 2, Winter Storm: 1, Other: 1 (Note: some incidents may be assigned to more than one category).
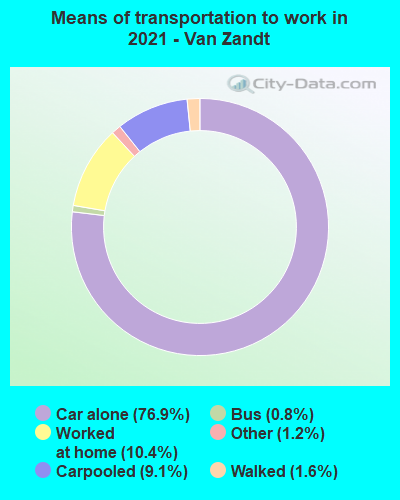
Means of transportation to work:
- Drove a car alone: 11,356 (70.2%)
- Carpooled: 1,676 (10.4%)
- Bus: 115 (0.7%)
- Ferryboat: 16 (0.1%)
- Taxicab, motorcycle, or other means: 176 (1.1%)
- Walked: 258 (1.6%)
- Worked at home: 2,674 (16.5%)
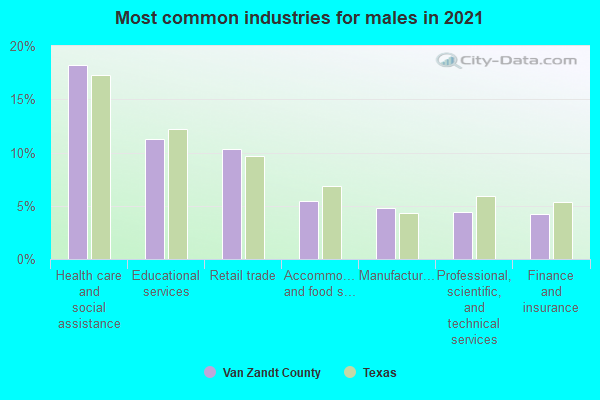
- Health care and social assistance (18%)
- Educational services (10%)
- Retail trade (10%)
- Accommodation and food services (7%)
- Professional, scientific, and technical services (4%)
- Finance and insurance (4%)
- Manufacturing (4%)
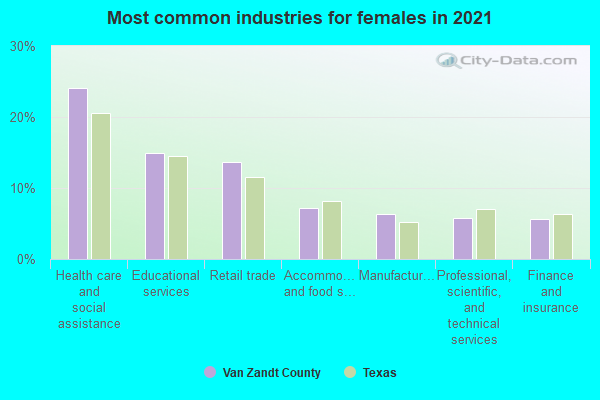
- Health care and social assistance (24%)
- Educational services (13%)
- Retail trade (13%)
- Accommodation and food services (9%)
- Professional, scientific, and technical services (5%)
- Finance and insurance (5%)
- Manufacturing (5%)
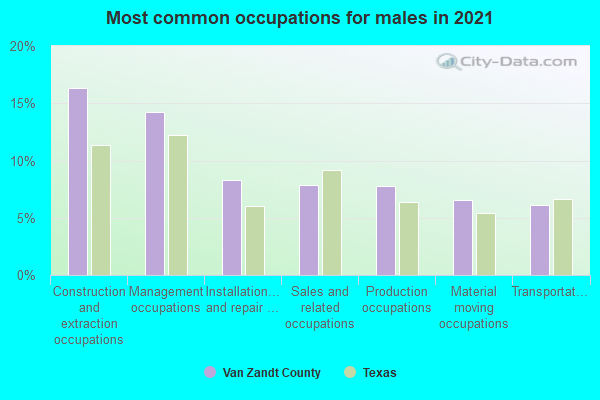
- Construction and extraction occupations (15%)
- Management occupations (13%)
- Sales and related occupations (9%)
- Production occupations (9%)
- Installation, maintenance, and repair occupations (8%)
- Material moving occupations (6%)
- Transportation occupations (5%)
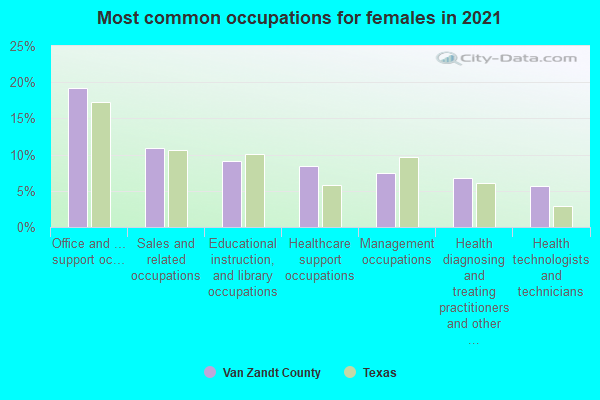
- Office and administrative support occupations (20%)
- Sales and related occupations (11%)
- Educational instruction, and library occupations (9%)
- Management occupations (8%)
- Healthcare support occupations (8%)
- Health diagnosing and treating practitioners and other technical occupations (6%)
- Food preparation and serving related occupations (6%)
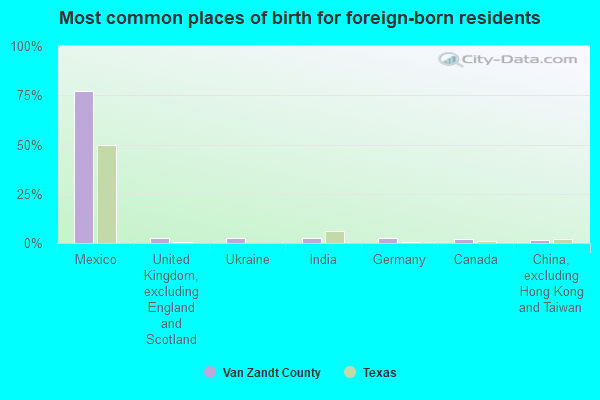
- Mexico (78%)
- Ukraine (3%)
- Other Northern America (2%)
- El Salvador (2%)
- Pakistan (2%)
- Germany (2%)
- China, excluding Hong Kong and Taiwan (1%)
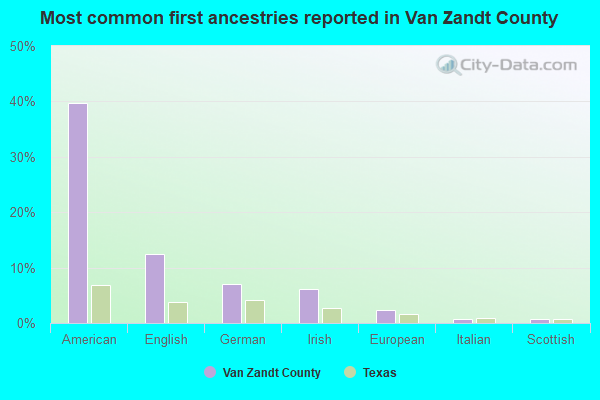
- American (35%)
- English (14%)
- Irish (7%)
- German (7%)
- European (2%)
- Italian (1%)
- Scottish (1%)
People in group quarters in Van Zandt County, Texas in 2010:
- 435 people in nursing facilities/skilled-nursing facilities
- 134 people in local jails and other municipal confinement facilities
- 64 people in mental (psychiatric) hospitals and psychiatric units in other hospitals
- 19 people in group homes intended for adults
- 15 people in correctional facilities intended for juveniles
People in group quarters in Van Zandt County, Texas in 2000:
- 570 people in nursing homes
- 167 people in other nonhousehold living situations
- 87 people in local jails and other confinement facilities (including police lockups)
- 50 people in hospitals or wards for drug/alcohol abuse
- 46 people in homes for the mentally retarded
- 11 people in other noninstitutional group quarters
- 9 people in short-term care, detention or diagnostic centers for delinquent children
- 6 people in other group homes
10.30% of this county's 2021 resident taxpayers lived in other counties in 2020 ($63,092 average adjusted gross income)
| Here: | 10.30% |
| Texas average: | 8.12% |
10 or fewer of this county's residents moved from foreign countries.
8.56% relocated from other counties in Texas ($49,298 average AGI)
1.74% relocated from other states ($13,793 average AGI)
Van Zandt County: 1.74% Texas average: 2.83%
Top counties from which taxpayers relocated into this county between 2020 and 2021:
| from Kaufman County, TX | |
| from Dallas County, TX | |
| from Henderson County, TX | |
| from Smith County, TX | |
| from Tarrant County, TX | |
| from Hunt County, TX | |
| from Collin County, TX |
7.57% of this county's 2020 resident taxpayers moved to other counties in 2021 ($45,459 average adjusted gross income)
| Here: | 7.57% |
| Texas average: | 7.40% |
10 or fewer of this county's residents moved to foreign countries.
6.58% relocated to other counties in Texas ($40,407 average AGI)
0.99% relocated to other states ($5,052 average AGI)
Van Zandt County: 0.99% Texas average: 2.08%
Top counties to which taxpayers relocated from this county between 2020 and 2021:
| to Smith County, TX | |
| to Henderson County, TX | |
| to Kaufman County, TX | |
| to Dallas County, TX | |
| to Wood County, TX | |
| to Hunt County, TX | |
| to Tarrant County, TX |
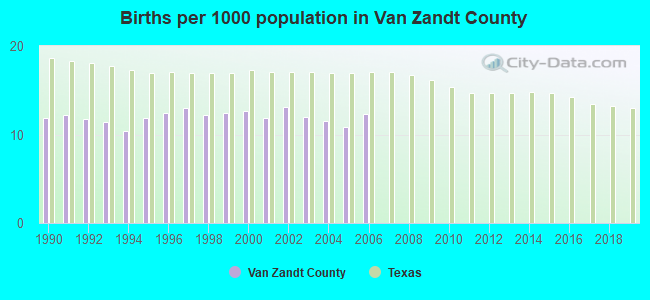
Births per 1000 population from 1990 to 1999: 12.0
Births per 1000 population from 2000 to 2006: 12.1
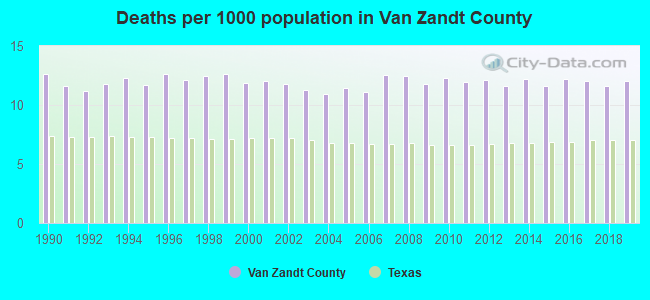
Deaths per 1000 population from 1990 to 1999: 12.1
Deaths per 1000 population from 2000 to 2009: 11.7
Deaths per 1000 population from 2010 to 2020: 12.2
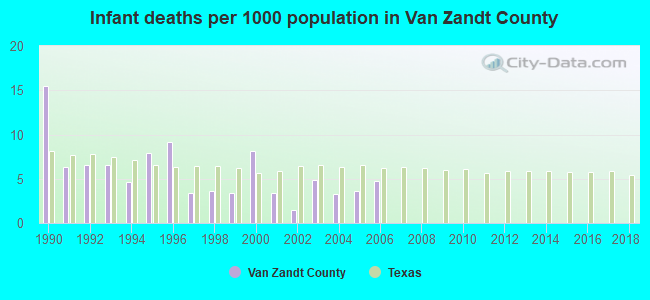
Infant deaths per 1000 live births from 1990 to 1999: 6.7
Infant deaths per 1000 live births from 2000 to 2006: 4.2
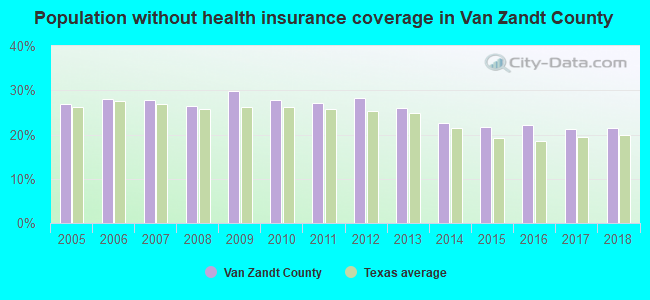
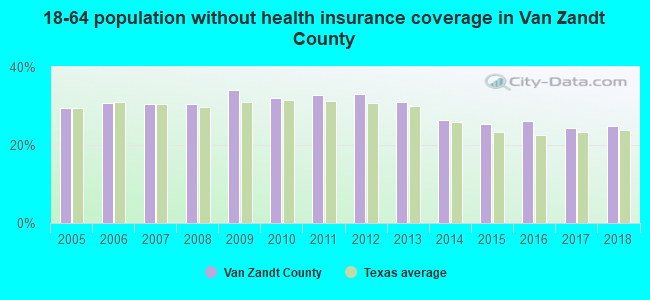
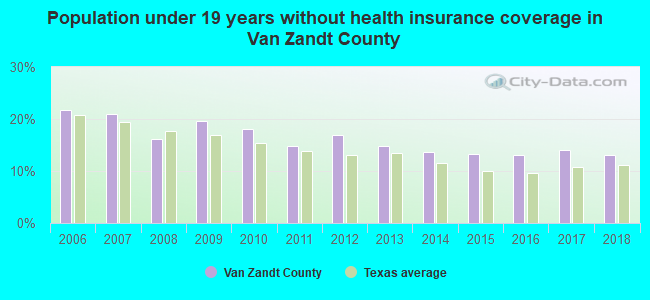
Persons under 19 years old without health insurance coverage in 2018: 13.1%
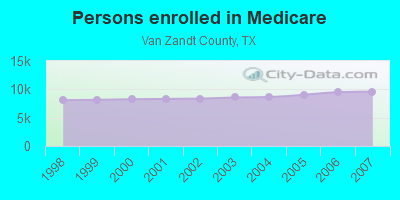
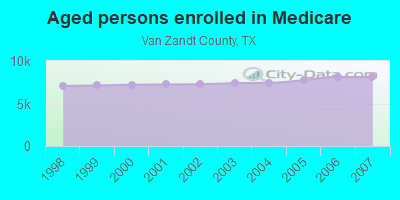
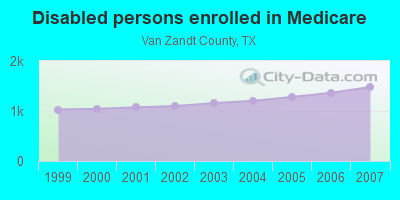
Persons enrolled in hospital insurance and/or supplemental medical insurance (Medicare) in July 1, 2007: 9,598 (8,116 aged, 1,482 disabled)
Children under 18 without health insurance coverage in 2007: 2,475 (20%)
Most common underlying causes of death in Van Zandt County, Texas in 1999 - 2019:
- Atherosclerotic heart disease (1,321)
- Bronchus or lung, unspecified - Malignant neoplasms (856)
- Acute myocardial infarction, unspecified (700)
- Chronic obstructive pulmonary disease, unspecified (672)
- Other ill-defined and unspecified causes of mortality (519)
- Congestive heart failure (428)
- Stroke, not specified as haemorrhage or infarction (375)
- Alzheimer disease, unspecified (260)
- Unspecified dementia (226)
- Atherosclerotic cardiovascular disease, so described (192)
Population without health insurance coverage in 2000: 16%
Children under 18 without health insurance coverage in 2000: 15%
Short term general hospital admissions per 100,000 population in 2004: 2,006
Short term general hospital beds per 100,000 population in 2004: 46
Emergency room visits per 100,000 population in 2004: 11,595
General practice office based MDs per 100,000 population in 2005: 1,236
Medical specialist MDs per 100,000 population in 2005: 1,130
Total births per 100,000 population, July 2005 - July 2006 : 25
Total deaths per 100,000 population, July 2005 - July 2006: 51
Homicides per 1,000,000 population from 2000 to 2006: 71.0. This is more than state average.
Suicides per 1,000,000 population from 2000 to 2006: 181.9. This is more than state average.
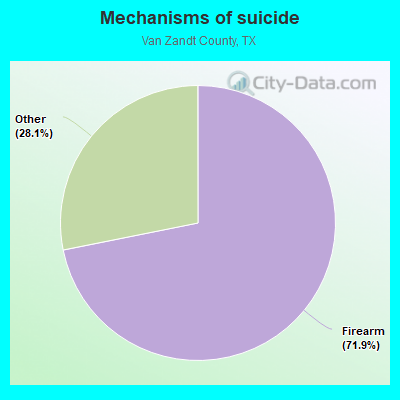
- Firearm - 130.7
- Other - 51.2
Household type by relationship:
Households: 61,667- Male householders: 11,374 (2,228 living alone), Female householders: 12,229 (3,489 living alone)
12,996 spouses (12,911 opposite-sex spouses), 1,465 unmarried partners, (1,456 opposite-sex unmarried partners), 15,588 children (13,654 natural, 527 adopted, 1,415 stepchildren), 2,466 grandchildren, 734 brothers or sisters, 820 parents, 137 foster children, 2,007 other relatives, 1,332 non-relatives
- In group quarters: 620
Size of family households: 7,961 2-persons, 3,731 3-persons, 2,579 4-persons, 1,498 5-persons, 700 6-persons, 425 7-or-more-persons.
Size of nonfamily households: 5,716 1-person, 833 2-persons, 107 3-persons, 20 4-persons, 9 5-persons, 27 7-or-more-persons.
7,911 married couples with children.
2,820 single-parent households (811 men, 2,009 women).
91.6% of residents of Van Zandt speak English at home.
7.9% of residents speak Spanish at home (68% speak English very well, 13% speak English well, 8% speak English not well, 11% don't speak English at all).
0.6% of residents speak other Indo-European language at home (89% speak English very well, 4% speak English well, 6% speak English not well).
0.1% of residents speak Asian or Pacific Island language at home (46% speak English very well, 31% speak English well, 23% speak English not well).
In fiscal year 2004:
Federal Government expenditure: $241,212,000 ($4,639 per capita)
Department of Defense expenditure: $6,289,000
Federal direct payments to individuals for retirement and disability: $128,317,000
Federal other direct payments to individuals: $71,416,000
Federal direct payments not to individuals: $1,106,000
Federal grants: $32,240,000
Federal procurement contracts: $1,851,000 ($2,000 Department of Defense)
Federal salaries and wages: $6,281,000 ($0,000 Department of Defense)
Federal Government direct loans: $282,000
Federal guaranteed/insured loans: $11,897,000
Federal Government insurance: $24,472,000
Population change from April 1, 2000 to July 1, 2005:
Births: 3,206| Here: | 61 per 1000 residents |
| State: | 85 per 1000 residents |
Deaths: 3,008
| Here: | 57 per 1000 residents |
| State: | 35 per 1000 residents |
Net international migration: +533
| Here: | +10 per 1000 residents |
| State: | +29 per 1000 residents |
Net internal migration: +3,681
| Here: | +70 per 1000 residents |
| State: | +10 per 1000 residents |
Total withdrawal of fresh water for public supply: 5.75 millions of gallons per day (44% from ground, 56% from surface)
| Here: | 5.9 |
| State: | 6.3 |
| Here: | 4.7 |
| State: | 4.0 |
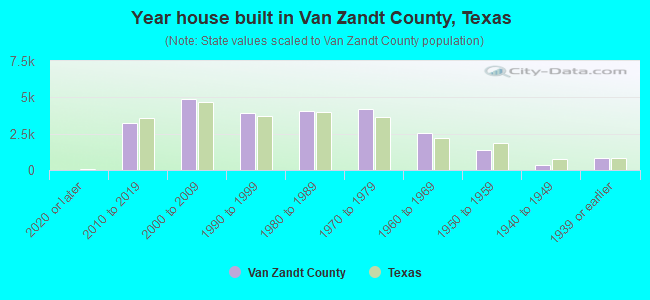
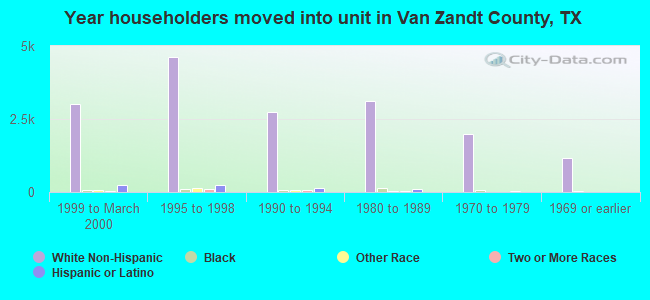
- Year house built in Van Zandt County, Texas
- 1562020 or later
- 4,0522010 to 2019
- 4,5302000 to 2009
- 3,9071990 to 1999
- 3,6731980 to 1989
- 3,9891970 to 1979
- 2,3681960 to 1969
- 1,5401950 to 1959
- 5211940 to 1949
- 8631939 or earlier
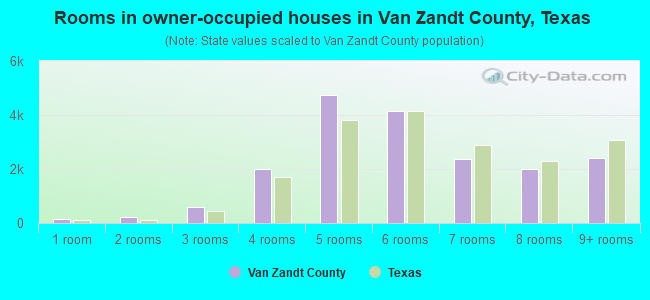
- Rooms in owner-occupied houses in Van Zandt County, Texas
- 1441 room
- 2762 rooms
- 6063 rooms
- 2,2644 rooms
- 4,5425 rooms
- 4,2956 rooms
- 2,6307 rooms
- 1,7868 rooms
- 2,3039+ rooms
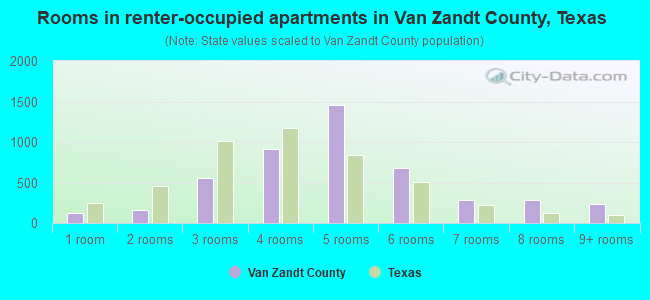
- Rooms in renter-occupied apartments in Van Zandt County, Texas
- 1231 room
- 1812 rooms
- 5253 rooms
- 9874 rooms
- 1,6995 rooms
- 5626 rooms
- 2797 rooms
- 1478 rooms
- 1939+ rooms
- Bedrooms in owner-occupied houses in Van Zandt County, Texas
- 222no bedroom
- 6961 bedroom
- 3,3522 bedrooms
- 10,5293 bedrooms
- 3,2264 bedrooms
- 7415+ bedrooms
- Bedrooms in renter-occupied apartments in Van Zandt County, Texas
- 179no bedroom
- 6711 bedroom
- 1,9642 bedrooms
- 1,7373 bedrooms
- 924 bedrooms
- 905+ bedrooms
- Cars and other vehicles available in Van Zandt County in owner-occupied houses/condos
- 282no vehicle
- 4,0931 vehicle
- 7,5782 vehicles
- 4,4713 vehicles
- 1,2554 vehicles
- 1,1215+ vehicles
- Cars and other vehicles available in Van Zandt County in renter-occupied apartments
- 418no vehicle
- 2,4081 vehicle
- 1,5142 vehicles
- 3253 vehicles
- 804 vehicles
- 445+ vehicles
87.2% of Van Zandt County residents lived in the same house 1 years ago.
Out of people who lived in different houses, 23% lived in this county.
Out of people who lived in different counties, 90% lived in Texas.
| Van Zandt County: | 87.2% |
| State average: | 85.7% |
Place of birth for U.S.-born residents:
- This state: 45,028
- Other state: 13,706
- Northeast: 1,368
- Midwest: 4,048
- South: 4,623
- West: 3,660
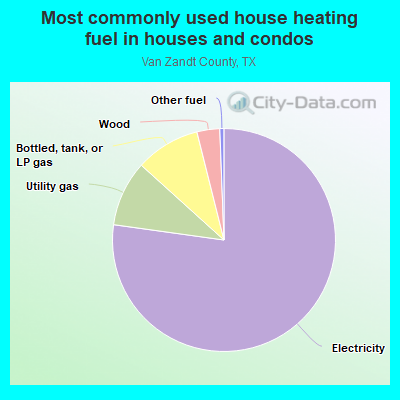
- 76.7%Electricity
- 10.1%Bottled, tank, or LP gas
- 10.1%Utility gas
- 2.5%Wood
- 0.4%Other fuel
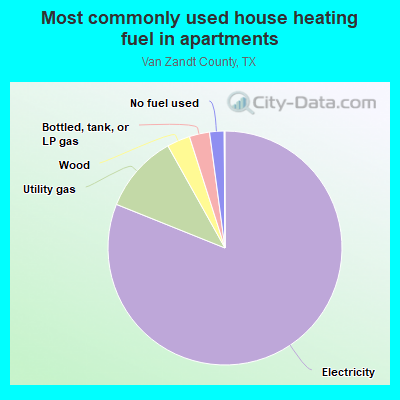
- 80.3%Electricity
- 10.0%Utility gas
- 3.3%Bottled, tank, or LP gas
- 3.3%Wood
- 2.7%No fuel used
- 0.4%Other fuel
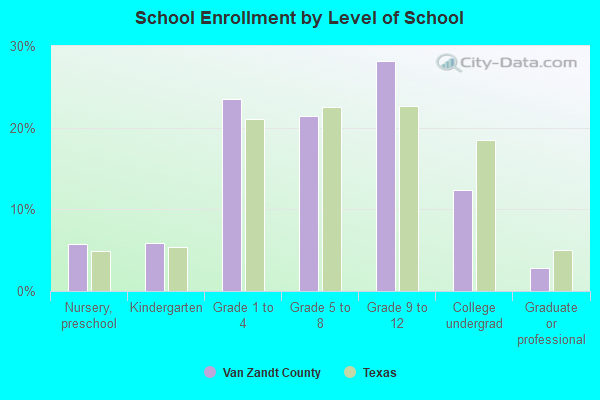
Private vs. public school enrollment:
| Here: | 11.9% |
| Texas: | 8.8% |
| Here: | 8.9% |
| Texas: | 8.0% |
| Here: | 19.0% |
| Texas: | 16.2% |
Van Zandt County government finances - Expenditure in 2017:
- Charges - Other: $1,024,000
- Construction - Regular Highways: $1,503,000
General - Other: $724,000
- Current Operations - Regular Highways: $4,751,000
Police Protection: $3,014,000
Judicial and Legal Services: $2,852,000
Correctional Institutions: $2,629,000
Financial Administration: $1,615,000
Central Staff Services: $1,082,000
General - Other: $622,000
Public Welfare, Vendor Payments for Medical Care: $264,000
General Public Buildings: $245,000
Local Fire Protection: $173,000
Libraries: $165,000
Natural Resources - Other: $114,000
Health - Other: $24,000
Corrections - Other: $1,000
- General - Interest on Debt: $324,000
- Long Term Debt - Beginning Outstanding - Unspecified Public Purpose: $8,705,000
Outstanding Unspecified Public Purpose: $8,255,000
Retired Unspecified Public Purpose: $450,000
- Miscellaneous - Fines and Forfeits: $1,015,000
General Revenue - Other: $161,000
Sale of Property: $72,000
Donations From Private Sources: $24,000
Rents: $2,000
Interest Earnings: $0
- Other Capital Outlay - Regular Highways: $459,000
General - Other: $112,000
Police Protection: $84,000
Financial Administration: $31,000
Central Staff Services: $6,000
Correctional Institutions: $3,000
Judicial and Legal Services: $3,000
Libraries: $2,000
Natural Resources - Other: $1,000
- State Intergovernmental - Other: $486,000
Highways: $415,000
General Local Government Support: $17,000
Health and Hospitals: $12,000
- Tax - Property: $12,537,000
Motor Vehicle License: $1,161,000
- Total Salaries and Wages: $6,289,000
Van Zandt County government finances - Revenue in 2017:
- Charges - Other: $1,024,000
- Construction - Regular Highways: $1,503,000
General - Other: $724,000
- Current Operations - Regular Highways: $4,751,000
Police Protection: $3,014,000
Judicial and Legal Services: $2,852,000
Correctional Institutions: $2,629,000
Financial Administration: $1,615,000
Central Staff Services: $1,082,000
General - Other: $622,000
Public Welfare, Vendor Payments for Medical Care: $264,000
General Public Buildings: $245,000
Local Fire Protection: $173,000
Libraries: $165,000
Natural Resources - Other: $114,000
Health - Other: $24,000
Corrections - Other: $1,000
- General - Interest on Debt: $324,000
- Long Term Debt - Beginning Outstanding - Unspecified Public Purpose: $8,705,000
Outstanding Unspecified Public Purpose: $8,255,000
Retired Unspecified Public Purpose: $450,000
- Miscellaneous - Fines and Forfeits: $1,015,000
General Revenue - Other: $161,000
Sale of Property: $72,000
Donations From Private Sources: $24,000
Rents: $2,000
Interest Earnings: $0
- Other Capital Outlay - Regular Highways: $459,000
General - Other: $112,000
Police Protection: $84,000
Financial Administration: $31,000
Central Staff Services: $6,000
Correctional Institutions: $3,000
Judicial and Legal Services: $3,000
Libraries: $2,000
Natural Resources - Other: $1,000
- State Intergovernmental - Other: $486,000
Highways: $415,000
General Local Government Support: $17,000
Health and Hospitals: $12,000
- Tax - Property: $12,537,000
Motor Vehicle License: $1,161,000
- Total Salaries and Wages: $6,289,000
Van Zandt County government finances - Debt in 2017:
- Charges - Other: $1,024,000
- Construction - Regular Highways: $1,503,000
General - Other: $724,000
- Current Operations - Regular Highways: $4,751,000
Police Protection: $3,014,000
Judicial and Legal Services: $2,852,000
Correctional Institutions: $2,629,000
Financial Administration: $1,615,000
Central Staff Services: $1,082,000
General - Other: $622,000
Public Welfare, Vendor Payments for Medical Care: $264,000
General Public Buildings: $245,000
Local Fire Protection: $173,000
Libraries: $165,000
Natural Resources - Other: $114,000
Health - Other: $24,000
Corrections - Other: $1,000
- General - Interest on Debt: $324,000
- Long Term Debt - Beginning Outstanding - Unspecified Public Purpose: $8,705,000
Outstanding Unspecified Public Purpose: $8,255,000
Retired Unspecified Public Purpose: $450,000
- Miscellaneous - Fines and Forfeits: $1,015,000
General Revenue - Other: $161,000
Sale of Property: $72,000
Donations From Private Sources: $24,000
Rents: $2,000
Interest Earnings: $0
- Other Capital Outlay - Regular Highways: $459,000
General - Other: $112,000
Police Protection: $84,000
Financial Administration: $31,000
Central Staff Services: $6,000
Correctional Institutions: $3,000
Judicial and Legal Services: $3,000
Libraries: $2,000
Natural Resources - Other: $1,000
- State Intergovernmental - Other: $486,000
Highways: $415,000
General Local Government Support: $17,000
Health and Hospitals: $12,000
- Tax - Property: $12,537,000
Motor Vehicle License: $1,161,000
- Total Salaries and Wages: $6,289,000
Van Zandt County government finances - Cash and Securities in 2017:
- Charges - Other: $1,024,000
- Construction - Regular Highways: $1,503,000
General - Other: $724,000
- Current Operations - Regular Highways: $4,751,000
Police Protection: $3,014,000
Judicial and Legal Services: $2,852,000
Correctional Institutions: $2,629,000
Financial Administration: $1,615,000
Central Staff Services: $1,082,000
General - Other: $622,000
Public Welfare, Vendor Payments for Medical Care: $264,000
General Public Buildings: $245,000
Local Fire Protection: $173,000
Libraries: $165,000
Natural Resources - Other: $114,000
Health - Other: $24,000
Corrections - Other: $1,000
- General - Interest on Debt: $324,000
- Long Term Debt - Beginning Outstanding - Unspecified Public Purpose: $8,705,000
Outstanding Unspecified Public Purpose: $8,255,000
Retired Unspecified Public Purpose: $450,000
- Miscellaneous - Fines and Forfeits: $1,015,000
General Revenue - Other: $161,000
Sale of Property: $72,000
Donations From Private Sources: $24,000
Rents: $2,000
Interest Earnings: $0
- Other Capital Outlay - Regular Highways: $459,000
General - Other: $112,000
Police Protection: $84,000
Financial Administration: $31,000
Central Staff Services: $6,000
Correctional Institutions: $3,000
Judicial and Legal Services: $3,000
Libraries: $2,000
Natural Resources - Other: $1,000
- State Intergovernmental - Other: $486,000
Highways: $415,000
General Local Government Support: $17,000
Health and Hospitals: $12,000
- Tax - Property: $12,537,000
Motor Vehicle License: $1,161,000
- Total Salaries and Wages: $6,289,000
Supplemental Security Income (SSI) in 2006:
- Total number of recipients: 1,042
- Number of aged recipients: 163
- Number of blind and disabled recipients: 879
- Number of recipients under 18: 151
- Number of recipients between 18 and 64: 639
- Number of recipients older than 64: 252
- Number of recipients also receiving OASDI: 427
- Amount of payments (thousands of dollars): 410
| Most common first names in Van Zandt County, TX among deceased individuals | ||
| Name | Count | Lived (average) |
|---|---|---|
| James | 439 | 71.7 years |
| William | 372 | 75.6 years |
| John | 324 | 75.5 years |
| Mary | 305 | 79.3 years |
| Robert | 229 | 73.7 years |
| Charles | 161 | 70.7 years |
| George | 141 | 76.5 years |
| Thomas | 133 | 74.1 years |
| Willie | 133 | 79.4 years |
| Ruby | 109 | 81.3 years |
| Most common last names in Van Zandt County, TX among deceased individuals | ||
| Last name | Count | Lived (average) |
|---|---|---|
| Smith | 205 | 75.4 years |
| Brown | 127 | 75.8 years |
| Jones | 124 | 75.7 years |
| Johnson | 121 | 75.8 years |
| Williams | 112 | 75.8 years |
| Davis | 111 | 74.8 years |
| Martin | 102 | 76.5 years |
| Taylor | 96 | 76.2 years |
| Moore | 84 | 78.3 years |
| Thompson | 81 | 75.4 years |
| Businesses in Van Zandt County, TX | ||||
| Name | Count | Name | Count | |
|---|---|---|---|---|
| AT&T | 1 | Lane Furniture | 1 | |
| Best Western | 1 | Long John Silver's | 1 | |
| Burger King | 1 | MasterBrand Cabinets | 1 | |
| CVS | 1 | McDonald's | 1 | |
| Carl\s Jr. | 1 | Motel 6 | 1 | |
| Chevrolet | 2 | Pizza Hut | 1 | |
| Church's Chicken | 1 | Quality | 1 | |
| Circle K | 1 | SONIC Drive-In | 4 | |
| Dairy Queen | 2 | Sears | 1 | |
| Days Inn | 1 | Subway | 4 | |
| Decora Cabinetry | 1 | Super 8 | 1 | |
| FedEx | 4 | Taco Bell | 1 | |
| H&R Block | 2 | U-Haul | 8 | |
| KFC | 1 | UPS | 7 | |
| La-Z-Boy | 1 | Walmart | 1 | |