Wood County, Texas (TX)
County owner-occupied free and clear houses and condos in 2010: 7,086
County owner-occupied houses and condos in 2000: 11,868
Renter-occupied apartments: 3,370 (it was 2,715 in 2000)
| % of renters here: | 19% |
| State: | 36% |
Land area: 650 sq. mi.
Water area: 45.6 sq. mi.
Population density: 72 people per square mile (average).
Industries providing employment: Educational, health and social services (20.4%), Retail trade (12.9%), Construction (10.7%), Professional, scientific, management, administrative, and waste management services (10.1%), Manufacturing (10.0%).
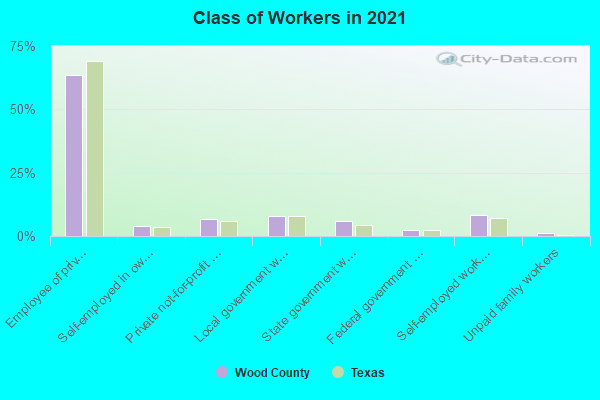
Type of workers:
- Private wage or salary: 74%
- Government: 16%
- Self-employed, not incorporated: 9%
- Unpaid family work: 1%
- OSM Map
- General Map
- Google Map
- MSN Map

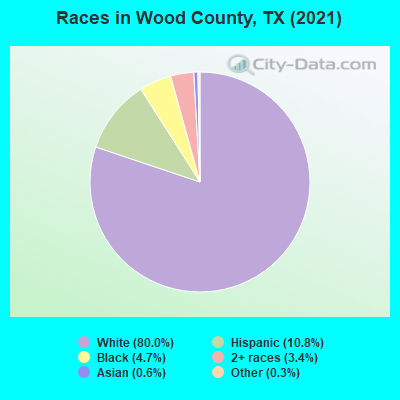
- 36,83880.4%White Non-Hispanic Alone
- 5,05911.0%Hispanic or Latino
- 1,8394.0%Black Non-Hispanic Alone
- 1,5963.5%Two or more races
- 2760.6%Asian alone
- 1730.4%Some other race alone
- 210.05%American Indian and Alaska Native alone
| Median resident age: | 48.9 years |
| Texas median age: | 35.6 years |
| Males: 23,370 | |
| Females: 23,190 |


| Wood County: | 2.0 people |
| Texas: | 3 people |
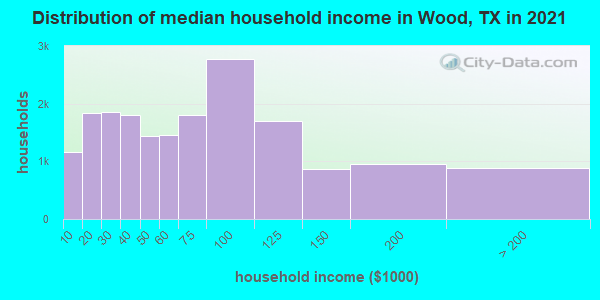
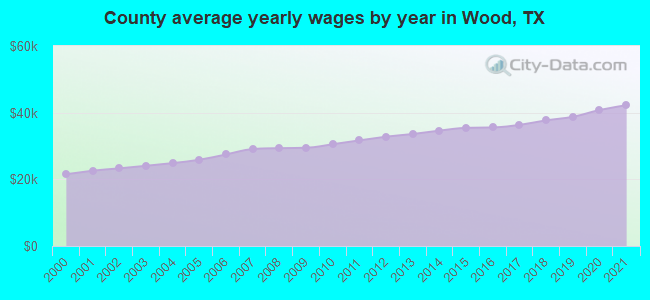
Estimated median household income in 2022: $61,113 ($32,885 in 1999)
| This county: | $61,113 |
| Texas: | $72,284 |
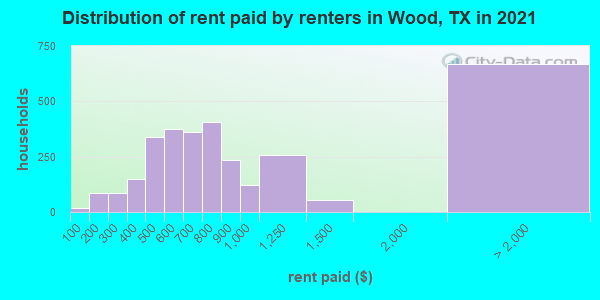
Median contract rent in 2022 for apartments: $719 (lower quartile is $527, upper quartile is $908)
| This county: | $719 |
| State: | $1117 |
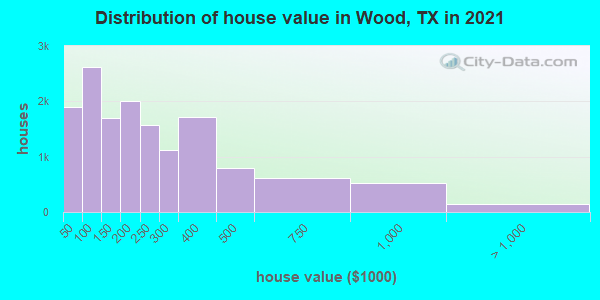
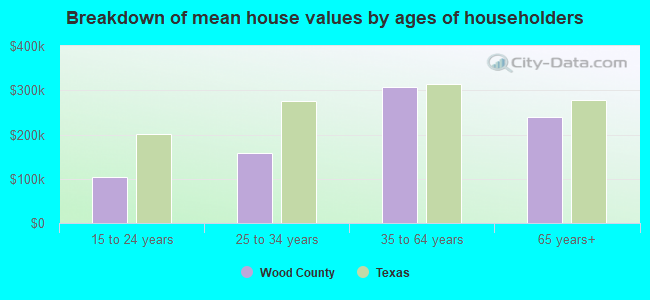
Estimated median house or condo value in 2022: $197,524 (it was $67,300 in 2000)
| Wood: | $197,524 |
| Texas: | $275,400 |
Median monthly housing costs for homes and condos with a mortgage: $1,427
Median monthly housing costs for units without a mortgage: $524
Institutionalized population: 619
Crime in 2021 (reported by the sheriff's office or county police, not the county total):
- Murders: 1
- Rapes: 8
- Robberies: 4
- Assaults: 24
- Burglaries: 64
- Thefts: 91
- Auto thefts: 20
Crime in 2020 (reported by the sheriff's office or county police, not the county total):
- Murders: 1
- Rapes: 12
- Robberies: 1
- Assaults: 21
- Burglaries: 51
- Thefts: 112
- Auto thefts: 18
Single-family new house construction building permits:
- 2022: 25 buildings, average cost: $237,200
- 2021: 18 buildings, average cost: $213,300
- 2020: 21 buildings, average cost: $196,400
- 2019: 17 buildings, average cost: $156,700
- 2018: 11 buildings, average cost: $157,800
- 2017: 3 buildings, average cost: $194,200
- 2016: 10 buildings, average cost: $179,400
- 2015: 0 buildings
- 2014: 4 buildings, average cost: $61,100
- 2013: 3 buildings, average cost: $100,000
- 2012: 5 buildings, average cost: $118,000
- 2011: 2 buildings, average cost: $82,500
- 2010: 3 buildings, average cost: $65,000
- 2009: 3 buildings, average cost: $185,000
- 2008: 12 buildings, average cost: $94,100
- 2007: 17 buildings, average cost: $105,000
- 2006: 10 buildings, average cost: $109,200
- 2005: 12 buildings, average cost: $118,700
- 2004: 17 buildings, average cost: $99,400
- 2003: 13 buildings, average cost: $110,900
- 2002: 14 buildings, average cost: $79,100
- 2001: 27 buildings, average cost: $83,800
- 2000: 13 buildings, average cost: $89,800
- 1999: 30 buildings, average cost: $59,500
- 1998: 15 buildings, average cost: $73,300
- 1997: 20 buildings, average cost: $70,100


Median real estate property taxes paid for housing units with mortgages in 2022: $2,211 (1.0%)
Median real estate property taxes paid for housing units with no mortgage in 2022: $1,632 (0.9%)
| Wood County: | 12.7% |
| Texas: | 14.0% |
Median age of residents in 2022: 48.9 years old
(Males: 47.9 years old, Females: 51.0 years old)
(Median age for: White residents: 53.0 years old, Black residents: 39.6 years old, American Indian residents: 35.0 years old, Asian residents: 40.1 years old, Hispanic or Latino residents: 25.5 years old, Other race residents: 41.1 years old)
Fair market rent in 2006 for a 1-bedroom apartment in Wood County is $367 a month.
Fair market rent for a 2-bedroom apartment is $484 a month.
Fair market rent for a 3-bedroom apartment is $705 a month.
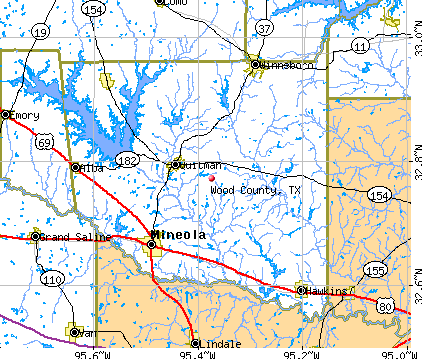
Cities in this county include: Mineola, Winnsboro, Holly Lake Ranch, Quitman, Hawkins, Alba, Yantis.
Neighboring counties: Choctaw County, Mississippi  , Coosa County, Alabama , Hampton County, South Carolina , Oktibbeha County, Mississippi , West Carroll Parish, Louisiana , Scott County, Mississippi .
| Here: | 3.8% |
| Texas: | 3.5% |
Current college students: 1,175
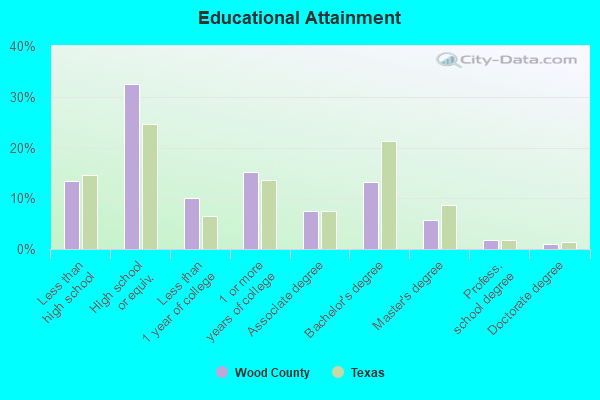
People 25 years of age or older with a high school degree or higher: 86.1%
People 25 years of age or older with a bachelor's degree or higher: 21.1%
Number of foreign born residents: 2,116 (36.6% naturalized citizens)
| Wood County: | 4.5% |
| Whole state: | 17.2% |
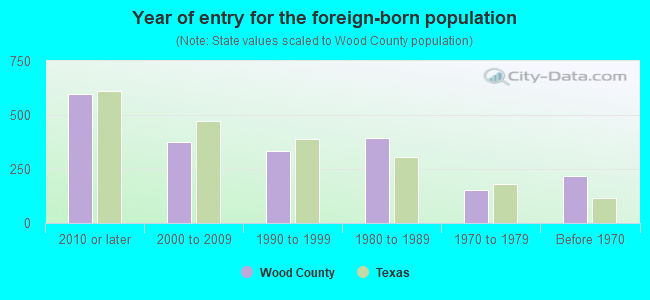
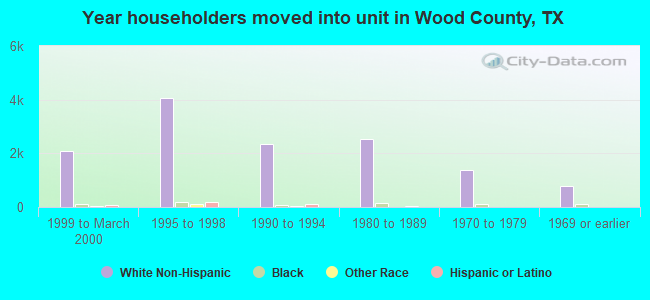
- Year of entry for the foreign-born population
- 7652010 or later
- 4082000 to 2009
- 3321990 to 1999
- 3951980 to 1989
- 1541970 to 1979
- 217Before 1970
Mean travel time to work (commute): minutes
Percentage of county residents living and working in this county: 98.8%
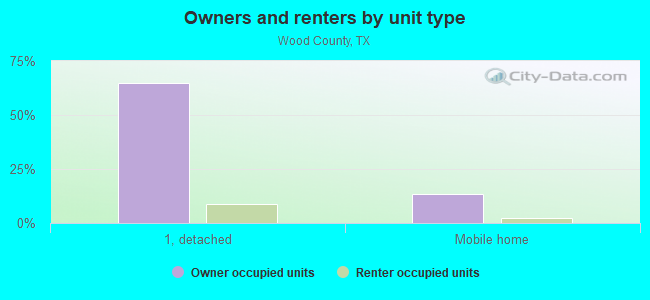
Housing units in structures:
- One, detached: 17,018
- One, attached: 196
- Two: 330
- 3 or 4: 452
- 5 to 9: 246
- 10 to 19: 181
- 20 to 49: 175
- 50 or more: 291
- Mobile homes: 3,510
- Boats, RVs, vans, etc.: 541
Housing units in Wood County with a mortgage: 5,876 (165 second mortgage, 0 home equity loan, 94 both second mortgage and home equity loan)
Houses without a mortgage: 15
| Here: | 25.0% with mortgage |
| State: | 98.4% with mortgage |
Religion statistics for Wood County
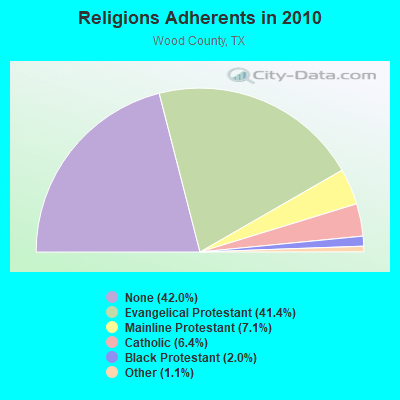
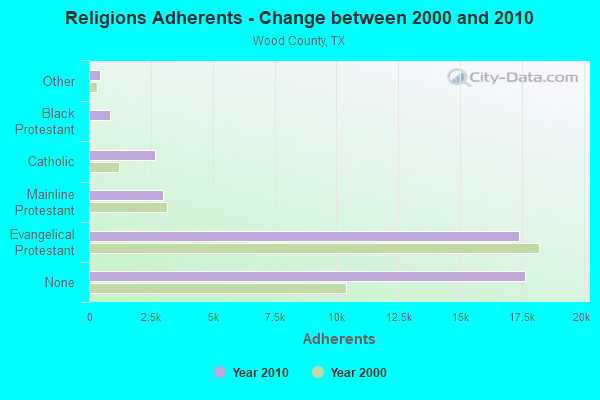
| Religion | Adherents | Congregations |
|---|---|---|
| Evangelical Protestant | 17,382 | 59 |
| Mainline Protestant | 2,996 | 20 |
| Catholic | 2,684 | 3 |
| Black Protestant | 829 | 5 |
| Other | 445 | 3 |
| None | 17,628 | - |
Source: Clifford Grammich, Kirk Hadaway, Richard Houseal, Dale E.Jones, Alexei Krindatch, Richie Stanley and Richard H.Taylor. 2012. 2010 U.S.Religion Census: Religious Congregations & Membership Study. Association of Statisticians of American Religious Bodies. Jones, Dale E., et al. 2002. Congregations and Membership in the United States 2000. Nashville, TN: Glenmary Research Center.
Food Environment Statistics:
| Wood County: | 1.20 / 10,000 pop. |
| State: | 1.47 / 10,000 pop. |
| Here: | 0.24 / 10,000 pop. |
| Texas: | 0.14 / 10,000 pop. |
| This county: | 0.24 / 10,000 pop. |
| Texas: | 1.11 / 10,000 pop. |
| Wood County: | 5.26 / 10,000 pop. |
| Texas: | 3.95 / 10,000 pop. |
| This county: | 5.98 / 10,000 pop. |
| State: | 6.13 / 10,000 pop. |
| Wood County: | 11.3% |
| Texas: | 8.9% |
| Wood County: | 27.5% |
| State: | 26.6% |
| Here: | 11.7% |
| State: | 15.7% |
Agriculture in Wood County:
Average size of farms: 153 acresAverage value of agricultural products sold per farm: $38,662
Average value of crops sold per acre for harvested cropland: $79.06
The value of nursery, greenhouse, floriculture, and sod as a percentage of the total market value of agricultural products sold: 0.79%
The value of livestock, poultry, and their products as a percentage of the total market value of agricultural products sold: 93.64%
Average total farm production expenses per farm: $33,233
Harvested cropland as a percentage of land in farms: 20.37%
Irrigated harvested cropland as a percentage of land in farms: 2.64%
Average market value of all machinery and equipment per farm: $31,647
The percentage of farms operated by a family or individual: 95.92%
Average age of principal farm operators: 57 years
Average number of cattle and calves per 100 acres of all land in farms: 30.59
Milk cows as a percentage of all cattle and calves: 13.79%
Corn for grain: 22 harvested acres
Vegetables: 371 harvested acres
Land in orchards: 339 acres
Earthquake activity:
Wood County-area historical earthquake activity is significantly above Texas state average. It is 433% greater than the overall U.S. average.On 11/6/2011 at 03:53:10, a magnitude 5.7 (5.7 MW, Depth: 3.2 mi, Class: Moderate, Intensity: VI - VII) earthquake occurred 206.9 miles away from Wood County center
On 9/3/2016 at 12:02:44, a magnitude 5.8 (5.8 MW, Depth: 3.5 mi) earthquake occurred 267.8 miles away from the county center
On 5/17/2012 at 08:12:00, a magnitude 4.8 (4.8 MW, Depth: 3.1 mi, Class: Light, Intensity: IV - V) earthquake occurred 82.9 miles away from the county center
On 9/2/2013 at 23:51:15, a magnitude 4.3 (4.3 MW, Depth: 2.9 mi) earthquake occurred 81.3 miles away from the county center
On 9/2/2013 at 21:52:38, a magnitude 4.2 (4.2 MW, Depth: 3.0 mi) earthquake occurred 74.6 miles away from Wood County center
On 11/7/2016 at 01:44:24, a magnitude 5.0 (5.0 MW, Depth: 2.8 mi) earthquake occurred 237.1 miles away from the county center
Magnitude types: moment magnitude (MW)
Most recent natural disasters:
- Texas Covid-19 Pandemic, Incident Period: January 20, 2020, FEMA Id: 4485, Natural disaster type: Other
- Texas Severe Storms and Flooding, Incident Period: April 17, 2016 to April 30, 2016, Major Disaster (Presidential) Declared DR-4269: April 25, 2016, FEMA Id: 4269, Natural disaster type: Storm, Flood
- Texas Hurricane Ike, Incident Period: September 07, 2008 to September 26, 2008, Emergency Declared EM-3294: September 10, 2008, FEMA Id: 3294, Natural disaster type: Hurricane
- Texas Wildfires, Incident Period: March 14, 2008 to September 01, 2008, Emergency Declared EM-3284: March 14, 2008, FEMA Id: 3284, Natural disaster type: Fire
- Texas Hawkins Fire, Incident Period: January 08, 2006, Fire Management Assistance Declared: January 08, 2006, FEMA Id: 2614, Natural disaster type: Fire
- Texas Hurricane Rita, Incident Period: September 23, 2005 to October 14, 2005, Major Disaster (Presidential) Declared DR-1606: September 24, 2005, FEMA Id: 1606, Natural disaster type: Hurricane
- Texas Hurricane Rita, Incident Period: September 20, 2005 to October 14, 2005, Emergency Declared EM-3261: September 21, 2005, FEMA Id: 3261, Natural disaster type: Hurricane
- Texas Hurricane Katrina, Incident Period: August 29, 2005 to October 01, 2005, Emergency Declared EM-3216: September 02, 2005, FEMA Id: 3216, Natural disaster type: Hurricane
- Texas Loss of the Space Shuttle Columbia, Incident Period: February 01, 2003, Emergency Declared EM-3171: February 01, 2003, FEMA Id: 3171, Natural disaster type: Other
- Texas Severe Winter Storm, Incident Period: December 12, 2000 to January 15, 2001, Major Disaster (Presidential) Declared DR-1356: January 08, 2001, FEMA Id: 1356, Natural disaster type: Winter Storm
- 1 other natural disasters have been reported since 1953.
The number of natural disasters in Wood County (11) is smaller than the US average (15).
Major Disasters (Presidential) Declared: 3
Emergencies Declared: 6
Causes of natural disasters: Hurricanes: 4, Fires: 3, Flood: 1, Storm: 1, Winter Storm: 1, Other: 2 (Note: some incidents may be assigned to more than one category).
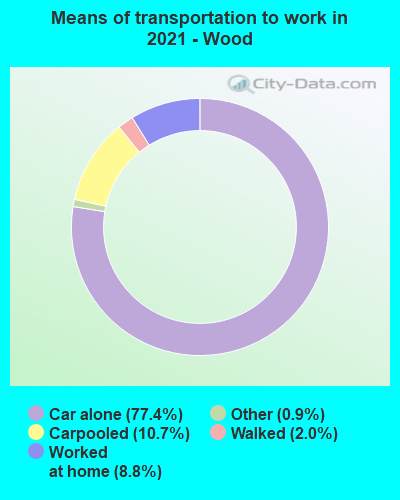
Means of transportation to work:
- Drove a car alone: 9,892 (72.4%)
- Carpooled: 1,488 (10.9%)
- Bus: 7 (0.1%)
- Taxicab, motorcycle, or other means: 130 (1.0%)
- Bicycle: 55 (0.4%)
- Walked: 194 (1.4%)
- Worked at home: 1,860 (13.6%)
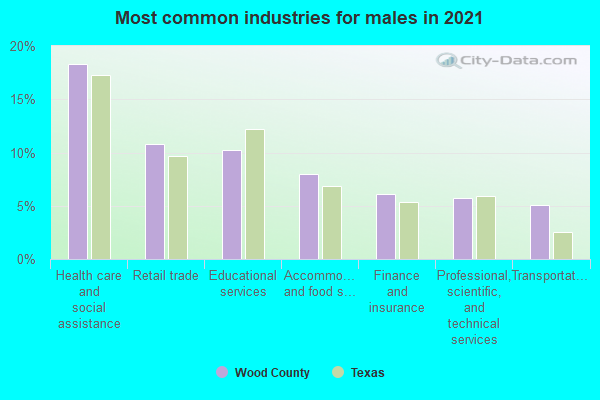
- Health care and social assistance (18%)
- Retail trade (11%)
- Educational services (10%)
- Professional, scientific, and technical services (7%)
- Finance and insurance (7%)
- Transportation and warehousing (6%)
- Accommodation and food services (6%)
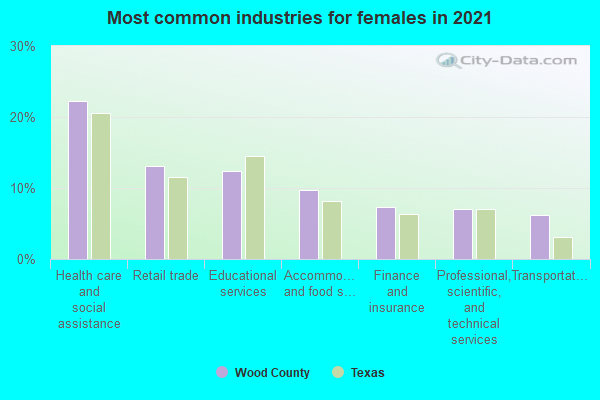
- Health care and social assistance (22%)
- Retail trade (13%)
- Educational services (13%)
- Professional, scientific, and technical services (8%)
- Finance and insurance (8%)
- Transportation and warehousing (7%)
- Accommodation and food services (7%)
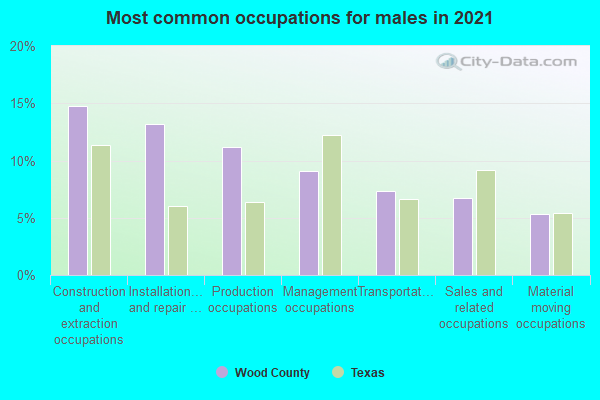
- Construction and extraction occupations (14%)
- Installation, maintenance, and repair occupations (13%)
- Production occupations (12%)
- Management occupations (9%)
- Transportation occupations (7%)
- Sales and related occupations (7%)
- Material moving occupations (6%)
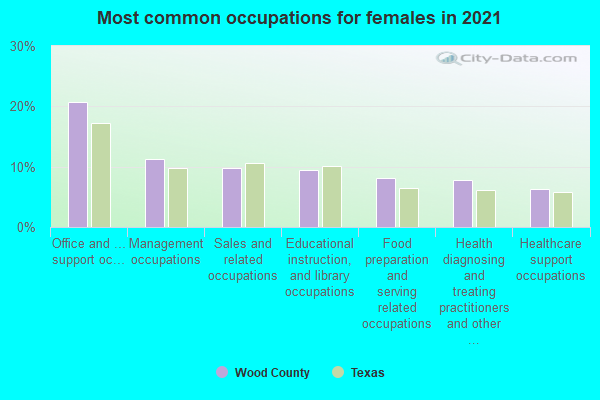
- Office and administrative support occupations (23%)
- Management occupations (12%)
- Educational instruction, and library occupations (10%)
- Sales and related occupations (9%)
- Health diagnosing and treating practitioners and other technical occupations (7%)
- Healthcare support occupations (6%)
- Food preparation and serving related occupations (6%)
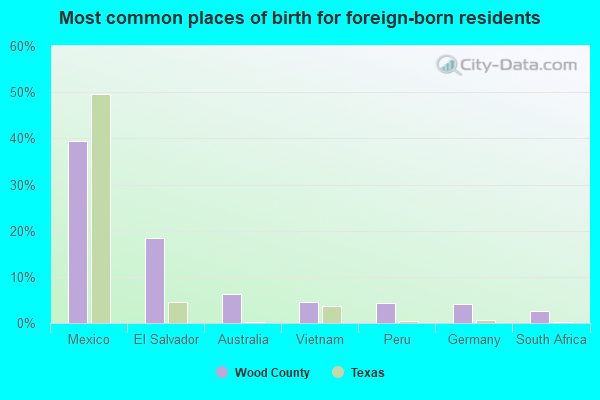
- Mexico (39%)
- El Salvador (20%)
- Australia (5%)
- South Africa (4%)
- Germany (4%)
- Peru (3%)
- Vietnam (3%)
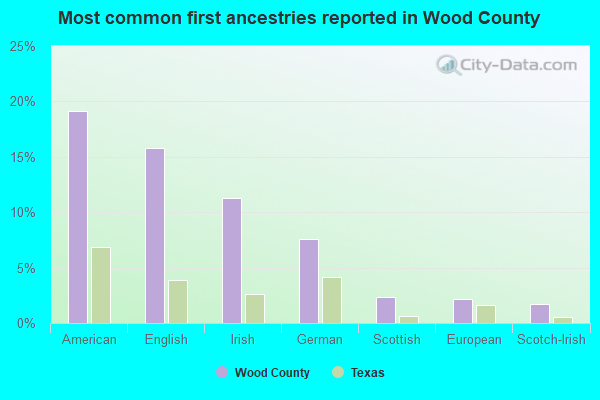
- American (22%)
- English (18%)
- Irish (9%)
- German (7%)
- Scotch-Irish (2%)
- Scottish (2%)
- European (2%)
People in group quarters in Wood County, Texas in 2010:
- 427 people in college/university student housing
- 353 people in nursing facilities/skilled-nursing facilities
- 182 people in state prisons
- 57 people in local jails and other municipal confinement facilities
- 44 people in group homes intended for adults
- 27 people in residential treatment centers for juveniles (non-correctional)
- 13 people in residential treatment centers for adults
People in group quarters in Wood County, Texas in 2000:
- 502 people in state prisons
- 465 people in nursing homes
- 373 people in college dormitories (includes college quarters off campus)
- 70 people in local jails and other confinement facilities (including police lockups)
- 42 people in other noninstitutional group quarters
- 6 people in wards in general hospitals for patients who have no usual home elsewhere
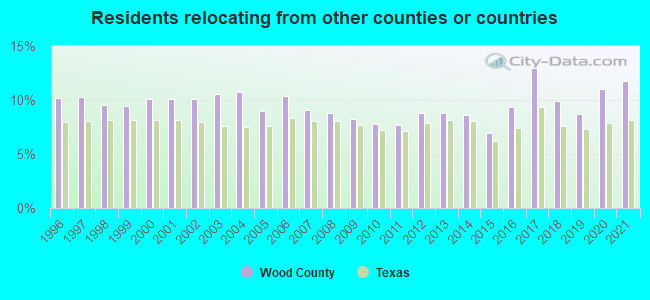
11.72% of this county's 2021 resident taxpayers lived in other counties in 2020 ($65,171 average adjusted gross income)
| Here: | 11.72% |
| Texas average: | 8.12% |
10 or fewer of this county's residents moved from foreign countries.
9.23% relocated from other counties in Texas ($51,921 average AGI)
2.49% relocated from other states ($13,250 average AGI)
Wood County: 2.49% Texas average: 2.83%
Top counties from which taxpayers relocated into this county between 2020 and 2021:
| from Dallas County, TX | |
| from Smith County, TX | |
| from Tarrant County, TX | |
| from Collin County, TX | |
| from Hopkins County, TX | |
| from Van Zandt County, TX | |
| from Upshur County, TX |
8.15% of this county's 2020 resident taxpayers moved to other counties in 2021 ($44,842 average adjusted gross income)
| Here: | 8.15% |
| Texas average: | 7.40% |
10 or fewer of this county's residents moved to foreign countries.
6.77% relocated to other counties in Texas ($38,616 average AGI)
1.38% relocated to other states ($6,226 average AGI)
Wood County: 1.38% Texas average: 2.08%

Top counties to which taxpayers relocated from this county between 2020 and 2021:
| to Smith County, TX | |
| to Hopkins County, TX | |
| to Upshur County, TX | |
| to Dallas County, TX | |
| to Gregg County, TX | |
| to Collin County, TX | |
| to Franklin County, TX |
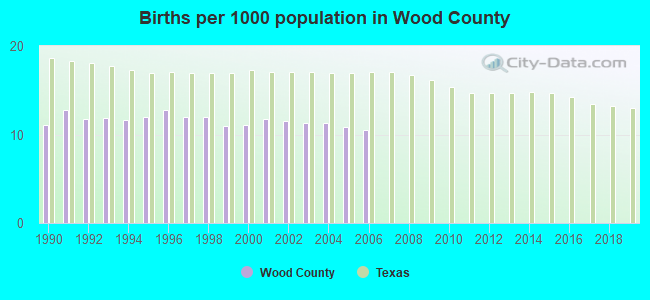
Births per 1000 population from 1990 to 1999: 11.9
Births per 1000 population from 2000 to 2006: 11.2
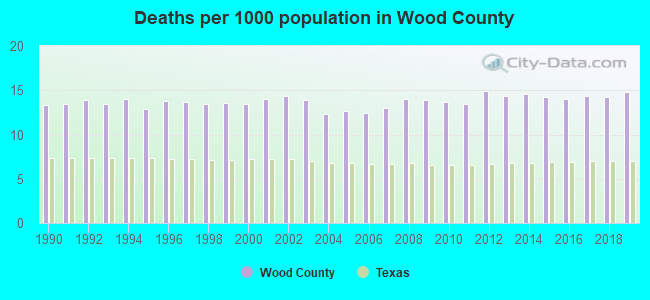
Deaths per 1000 population from 1990 to 1999: 13.5
Deaths per 1000 population from 2000 to 2009: 13.4
Deaths per 1000 population from 2010 to 2020: 14.4
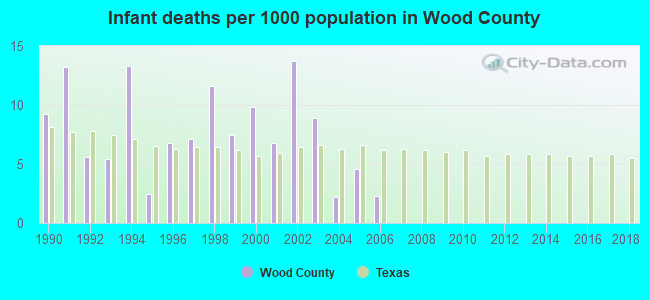
Infant deaths per 1000 live births from 1990 to 1999: 8.2
Infant deaths per 1000 live births from 2000 to 2006: 6.9
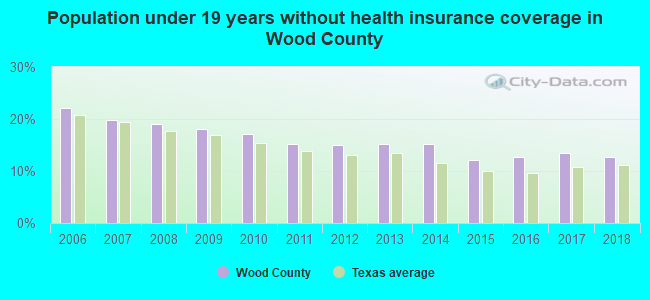
Persons under 19 years old without health insurance coverage in 2018: 12.6%
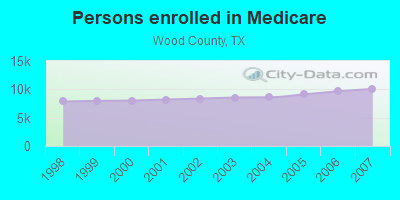
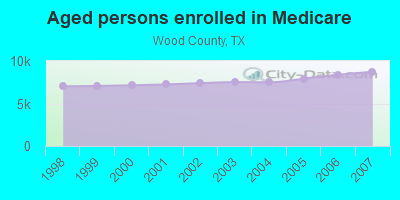
Persons enrolled in hospital insurance and/or supplemental medical insurance (Medicare) in July 1, 2007: 10,079 (8,742 aged, 1,337 disabled)
Children under 18 without health insurance coverage in 2007: 1,679 (19%)

Most common underlying causes of death in Wood County, Texas in 1999 - 2019:
- Acute myocardial infarction, unspecified (1,211)
- Bronchus or lung, unspecified - Malignant neoplasms (837)
- Atherosclerotic heart disease (599)
- Chronic obstructive pulmonary disease, unspecified (598)
- Unspecified dementia (517)
- Congestive heart failure (382)
- Stroke, not specified as haemorrhage or infarction (298)
- Pulmonary embolism without mention of acute cor pulmonale (250)
- Alzheimer disease, unspecified (222)
- Pneumonia, unspecified (125)
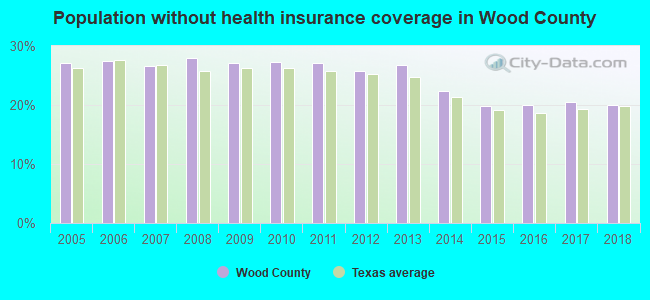
Population without health insurance coverage in 2000: 18%
Children under 18 without health insurance coverage in 2000: 17%
Short term general hospital admissions per 100,000 population in 2004: 6,688
Short term general hospital beds per 100,000 population in 2004: 183
Emergency room visits per 100,000 population in 2004: 35,791
General practice office based MDs per 100,000 population in 2005: 1,172
Medical specialist MDs per 100,000 population in 2005: 1,172
Total births per 100,000 population, July 2005 - July 2006 : 23
Total deaths per 100,000 population, July 2005 - July 2006: 69
Limited-service eating places per 100,000 population in 2005 : 15
Suicides per 1,000,000 population from 2000 to 2006: 175.2. This is more than state average.
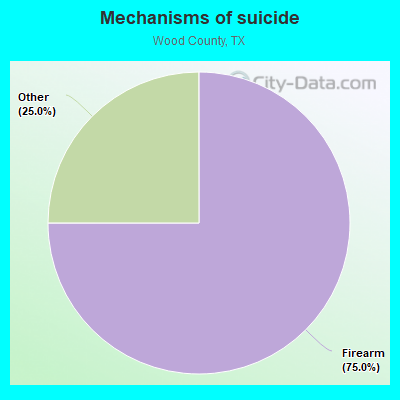
- Firearm - 131.4
- Other - 43.8
Household type by relationship:
Households: 46,560- Male householders: 9,527 (2,213 living alone), Female householders: 9,310 (3,321 living alone)
10,145 spouses (10,020 opposite-sex spouses), 857 unmarried partners, (843 opposite-sex unmarried partners), 10,467 children (9,626 natural, 414 adopted, 428 stepchildren), 1,411 grandchildren, 439 brothers or sisters, 624 parents, 34 foster children, 927 other relatives, 1,272 non-relatives
- In group quarters: 1,635
Size of family households: 7,105 2-persons, 2,309 3-persons, 1,840 4-persons, 771 5-persons, 382 6-persons, 155 7-or-more-persons.
Size of nonfamily households: 5,533 1-person, 692 2-persons, 98 3-persons, 24 4-persons.
5,009 married couples with children.
1,985 single-parent households (651 men, 1,334 women).
91.1% of residents of Wood speak English at home.
7.4% of residents speak Spanish at home (60% speak English very well, 22% speak English well, 12% speak English not well, 6% don't speak English at all).
1.0% of residents speak other Indo-European language at home (84% speak English very well, 5% speak English well, 11% speak English not well).
0.5% of residents speak Asian or Pacific Island language at home (75% speak English very well, 25% speak English well).
0.4% of residents speak other language at home (67% speak English very well, 33% don't speak English at all).
In fiscal year 2004:
Federal Government expenditure: $239,345,000 ($5,931 per capita)
Department of Defense expenditure: $8,786,000
Federal direct payments to individuals for retirement and disability: $133,912,000
Federal other direct payments to individuals: $59,947,000
Federal direct payments not to individuals: $587,000
Federal grants: $37,055,000
Federal procurement contracts: $1,425,000 ($0,000 Department of Defense)
Federal salaries and wages: $6,421,000 ($636,000 Department of Defense)
Federal Government direct loans: $3,608,000
Federal guaranteed/insured loans: $10,168,000
Federal Government insurance: $2,962,000
Population change from April 1, 2000 to July 1, 2005:
Births: 2,317| Here: | 57 per 1000 residents |
| State: | 85 per 1000 residents |
Deaths: 2,820
| Here: | 69 per 1000 residents |
| State: | 35 per 1000 residents |
Net international migration: +312
| Here: | +8 per 1000 residents |
| State: | +29 per 1000 residents |
Net internal migration: +4,355
| Here: | +107 per 1000 residents |
| State: | +10 per 1000 residents |

Total withdrawal of fresh water for public supply: 4.52 millions of gallons per day (92% from ground, 8% from surface)
| Here: | 5.7 |
| State: | 6.3 |
| Here: | 4.3 |
| State: | 4.0 |
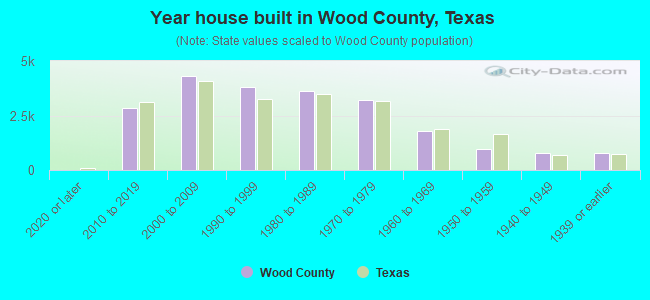
- Year house built in Wood County, Texas
- 582020 or later
- 2,9292010 to 2019
- 4,1342000 to 2009
- 4,2321990 to 1999
- 3,4851980 to 1989
- 3,1431970 to 1979
- 1,7001960 to 1969
- 7811950 to 1959
- 7901940 to 1949
- 8211939 or earlier

- Rooms in owner-occupied houses in Wood County, Texas
- 1091 room
- 3232 rooms
- 9733 rooms
- 1,9074 rooms
- 3,6035 rooms
- 3,4216 rooms
- 2,2347 rooms
- 1,3928 rooms
- 1,3079+ rooms

- Rooms in renter-occupied apartments in Wood County, Texas
- 4091 room
- 3022 rooms
- 4423 rooms
- 8694 rooms
- 7955 rooms
- 5076 rooms
- 2307 rooms
- 498 rooms
- 899+ rooms
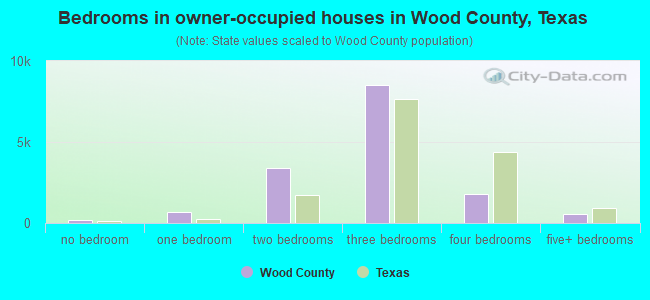
- Bedrooms in owner-occupied houses in Wood County, Texas
- 229no bedroom
- 7651 bedroom
- 3,2732 bedrooms
- 8,4533 bedrooms
- 1,8874 bedrooms
- 5225+ bedrooms

- Bedrooms in renter-occupied apartments in Wood County, Texas
- 416no bedroom
- 8551 bedroom
- 9442 bedrooms
- 1,2333 bedrooms
- 2294 bedrooms
- 245+ bedrooms
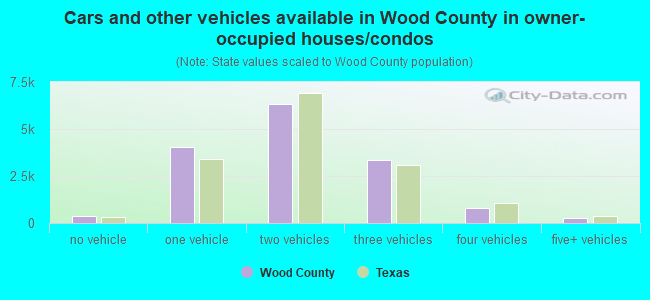
- Cars and other vehicles available in Wood County in owner-occupied houses/condos
- 400no vehicle
- 3,9781 vehicle
- 6,5332 vehicles
- 3,2213 vehicles
- 7494 vehicles
- 3165+ vehicles
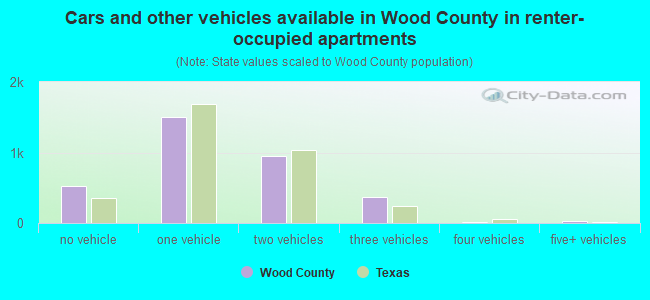
- Cars and other vehicles available in Wood County in renter-occupied apartments
- 672no vehicle
- 1,5831 vehicle
- 9662 vehicles
- 3943 vehicles
- 174 vehicles
- 365+ vehicles
83.7% of Wood County residents lived in the same house 1 years ago.
Out of people who lived in different houses, 28% lived in this county.
Out of people who lived in different counties, 82% lived in Texas.
| Wood County: | 83.7% |
| State average: | 85.7% |
Place of birth for U.S.-born residents:
- This state: 31,158
- Other state: 12,804
- Northeast: 1,786
- Midwest: 2,843
- South: 4,531
- West: 3,650
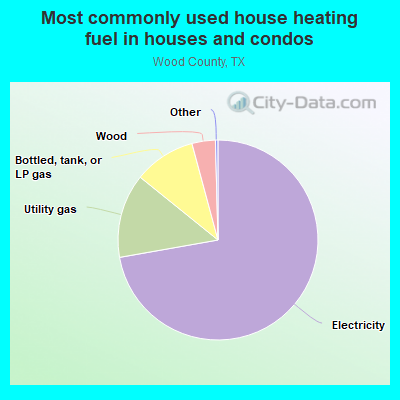
- 72.9%Electricity
- 14.4%Utility gas
- 9.0%Bottled, tank, or LP gas
- 3.4%Wood
- 0.1%No fuel used
- 0.1%Fuel oil, kerosene, etc.
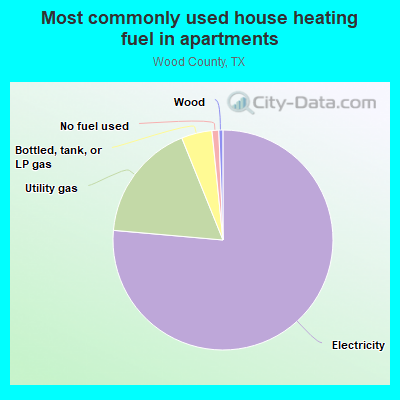
- 74.4%Electricity
- 16.6%Utility gas
- 6.9%Bottled, tank, or LP gas
- 1.1%No fuel used
- 0.5%Wood
- 0.5%Other fuel
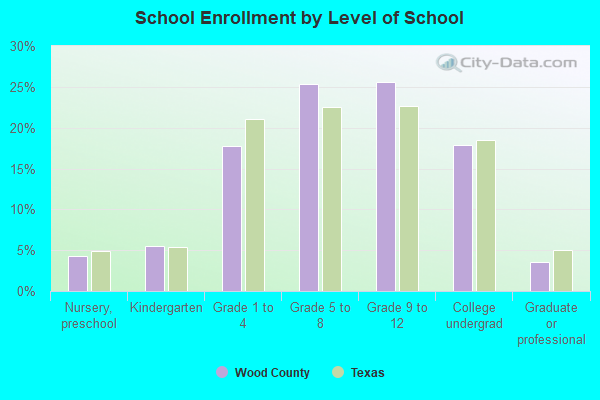
Private vs. public school enrollment:
| Here: | 9.7% |
| Texas: | 8.8% |
| Here: | 16.4% |
| Texas: | 8.0% |
| Here: | 15.6% |
| Texas: | 16.2% |


Wood County government finances - Expenditure in 2017:
- Charges - Other: $1,719,000
Regular Highways: $582,000
- Current Operations - Regular Highways: $4,818,000
Judicial and Legal Services: $4,410,000
Police Protection: $3,006,000
Correctional Institutions: $2,062,000
Financial Administration: $1,487,000
General - Other: $1,372,000
Central Staff Services: $696,000
Local Fire Protection: $458,000
General Public Buildings: $337,000
Corrections - Other: $229,000
- Miscellaneous - Fines and Forfeits: $426,000
Interest Earnings: $216,000
General Revenue - Other: $203,000
Sale of Property: $182,000
- Other Capital Outlay - Regular Highways: $359,000
General - Other: $344,000
- Other Funds - Cash and Securities: $24,583,000
- Sinking Funds - Cash and Securities: $59,000
- State Intergovernmental - General Local Government Support: $619,000
Other: $474,000
- Tax - Property: $15,961,000
General Sales and Gross Receipts: $1,579,000
Motor Vehicle License: $360,000
Wood County government finances - Revenue in 2017:
- Charges - Other: $1,719,000
Regular Highways: $582,000
- Current Operations - Regular Highways: $4,818,000
Judicial and Legal Services: $4,410,000
Police Protection: $3,006,000
Correctional Institutions: $2,062,000
Financial Administration: $1,487,000
General - Other: $1,372,000
Central Staff Services: $696,000
Local Fire Protection: $458,000
General Public Buildings: $337,000
Corrections - Other: $229,000
- Miscellaneous - Fines and Forfeits: $426,000
Interest Earnings: $216,000
General Revenue - Other: $203,000
Sale of Property: $182,000
- Other Capital Outlay - Regular Highways: $359,000
General - Other: $344,000
- Other Funds - Cash and Securities: $24,583,000
- Sinking Funds - Cash and Securities: $59,000
- State Intergovernmental - General Local Government Support: $619,000
Other: $474,000
- Tax - Property: $15,961,000
General Sales and Gross Receipts: $1,579,000
Motor Vehicle License: $360,000
Wood County government finances - Debt in 2017:
- Charges - Other: $1,719,000
Regular Highways: $582,000
- Current Operations - Regular Highways: $4,818,000
Judicial and Legal Services: $4,410,000
Police Protection: $3,006,000
Correctional Institutions: $2,062,000
Financial Administration: $1,487,000
General - Other: $1,372,000
Central Staff Services: $696,000
Local Fire Protection: $458,000
General Public Buildings: $337,000
Corrections - Other: $229,000
- Miscellaneous - Fines and Forfeits: $426,000
Interest Earnings: $216,000
General Revenue - Other: $203,000
Sale of Property: $182,000
- Other Capital Outlay - Regular Highways: $359,000
General - Other: $344,000
- Other Funds - Cash and Securities: $24,583,000
- Sinking Funds - Cash and Securities: $59,000
- State Intergovernmental - General Local Government Support: $619,000
Other: $474,000
- Tax - Property: $15,961,000
General Sales and Gross Receipts: $1,579,000
Motor Vehicle License: $360,000
Wood County government finances - Cash and Securities in 2017:
- Charges - Other: $1,719,000
Regular Highways: $582,000
- Current Operations - Regular Highways: $4,818,000
Judicial and Legal Services: $4,410,000
Police Protection: $3,006,000
Correctional Institutions: $2,062,000
Financial Administration: $1,487,000
General - Other: $1,372,000
Central Staff Services: $696,000
Local Fire Protection: $458,000
General Public Buildings: $337,000
Corrections - Other: $229,000
- Miscellaneous - Fines and Forfeits: $426,000
Interest Earnings: $216,000
General Revenue - Other: $203,000
Sale of Property: $182,000
- Other Capital Outlay - Regular Highways: $359,000
General - Other: $344,000
- Other Funds - Cash and Securities: $24,583,000
- Sinking Funds - Cash and Securities: $59,000
- State Intergovernmental - General Local Government Support: $619,000
Other: $474,000
- Tax - Property: $15,961,000
General Sales and Gross Receipts: $1,579,000
Motor Vehicle License: $360,000
Supplemental Security Income (SSI) in 2006:
- Total number of recipients: 856
- Number of aged recipients: 117
- Number of blind and disabled recipients: 739
- Number of recipients under 18: 109
- Number of recipients between 18 and 64: 542
- Number of recipients older than 64: 205
- Number of recipients also receiving OASDI: 374
- Amount of payments (thousands of dollars): 339
| Most common first names in Wood County, TX among deceased individuals | ||
| Name | Count | Lived (average) |
|---|---|---|
| James | 409 | 73.1 years |
| William | 314 | 76.3 years |
| John | 301 | 76.8 years |
| Mary | 299 | 78.9 years |
| Robert | 219 | 74.1 years |
| Charles | 152 | 71.9 years |
| George | 114 | 76.1 years |
| Willie | 108 | 77.7 years |
| Thomas | 104 | 77.0 years |
| Roy | 89 | 76.2 years |
| Most common last names in Wood County, TX among deceased individuals | ||
| Last name | Count | Lived (average) |
|---|---|---|
| Williams | 160 | 76.0 years |
| Smith | 156 | 76.7 years |
| Jones | 131 | 77.3 years |
| Johnson | 124 | 76.4 years |
| Brown | 112 | 77.3 years |
| Davis | 109 | 74.4 years |
| Taylor | 108 | 77.9 years |
| Wilson | 90 | 77.1 years |
| Turner | 79 | 77.9 years |
| Moore | 77 | 76.4 years |
| Businesses in Wood County, TX | ||||
| Name | Count | Name | Count | |
|---|---|---|---|---|
| Ace Hardware | 1 | Nike | 1 | |
| Alco Stores | 1 | Pizza Hut | 1 | |
| Best Western | 1 | RadioShack | 2 | |
| Chevrolet | 1 | SONIC Drive-In | 4 | |
| Dairy Queen | 3 | Sears | 1 | |
| FedEx | 6 | Subway | 4 | |
| Goodwill | 1 | Taco Bell | 1 | |
| H&R Block | 2 | U-Haul | 3 | |
| Jones New York | 1 | UPS | 1 | |
| Lane Furniture | 2 | Walmart | 1 | |
| McDonald's | 1 | |||