Warren County, Virginia (VA)
County owner-occupied free and clear houses and condos in 2010: 2,489
County owner-occupied houses and condos in 2000: 8,958
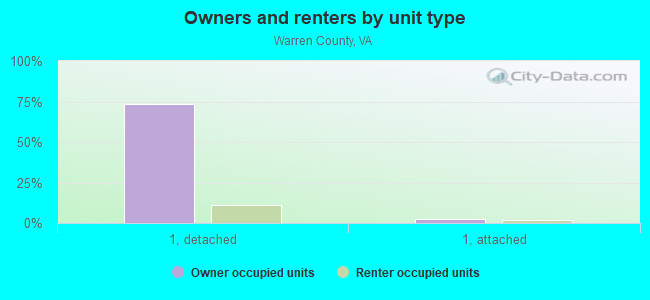
Renter-occupied apartments: 3,506 (it was 3,129 in 2000)
| % of renters here: | 26% |
| State: | 33% |
Land area: 214 sq. mi.
Water area: 2.6 sq. mi.
Population density: 192 people per square mile (high).
Industries providing employment: Educational, health and social services (20.9%), Professional, scientific, management, administrative, and waste management services (14.4%), Construction (12.5%), Retail trade (11.8%).
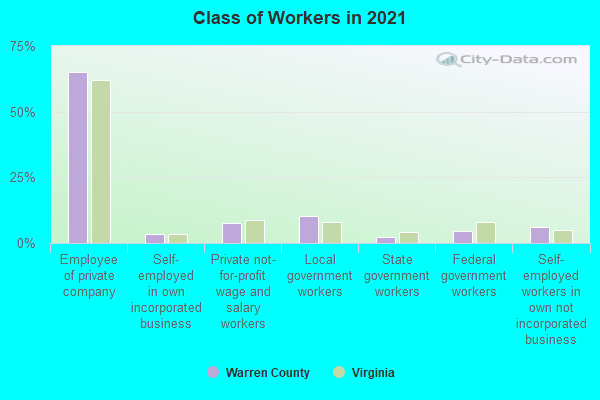
Type of workers:
- Private wage or salary: 77%
- Government: 18%
- Self-employed, not incorporated: 5%
- Unpaid family work: 0%
- OSM Map
- General Map
- Google Map
- MSN Map

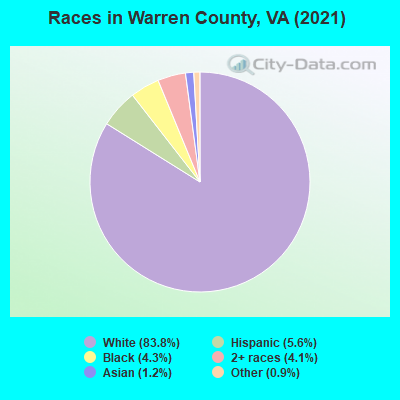
- 33,43181.9%White Non-Hispanic Alone
- 2,7026.6%Hispanic or Latino
- 2,0965.1%Black Non-Hispanic Alone
- 1,5733.9%Two or more races
- 5611.4%Asian alone
- 4261.0%Some other race alone
- 200.05%American Indian and Alaska Native alone
| Median resident age: | 41.2 years |
| Virginia median age: | 39.0 years |
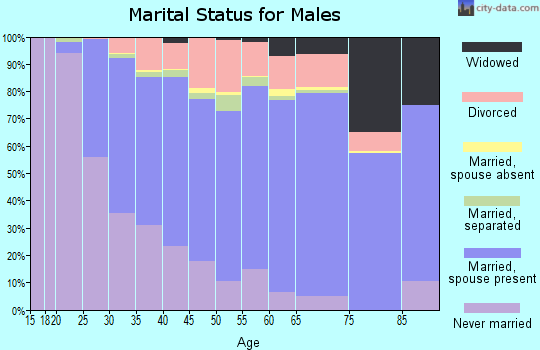
| Males: 20,716 | |
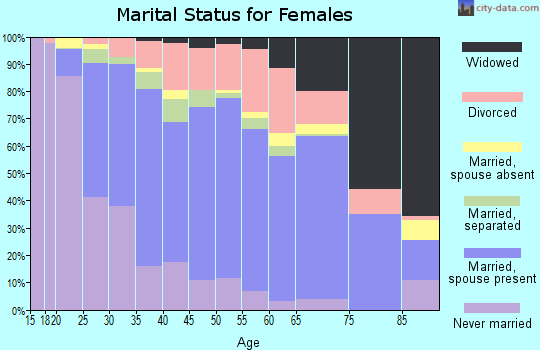
| Females: 20,363 |

 | Charlottesville downtown mall, as nice as the pictures? (57 replies) |
| Thinking of where in Northern/Western Virginia I should buy my last house (4 replies) |
| Crozet apartments… (3 replies) |
| Official Reckless Driving Thread (2249 replies) |
| Where is Northern Virginia? (25 replies) |
| Moving to NOVA - Work in Dulles (6 replies) |
| Warren County: | 2.0 people |
| Virginia: | 3 people |
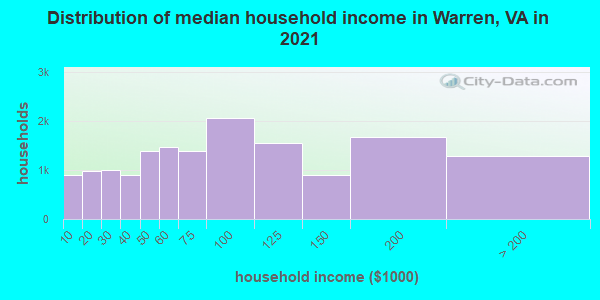
Estimated median household income in 2022: $78,062 ($42,422 in 1999)
| This county: | $78,062 |
| Virginia: | $85,873 |
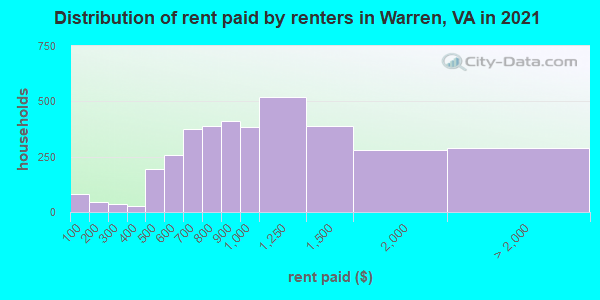
Median contract rent in 2022 for apartments: $976 (lower quartile is $695, upper quartile is $1,249)
| This county: | $976 |
| State: | $1270 |
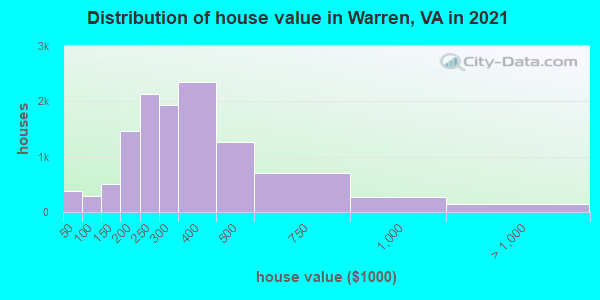
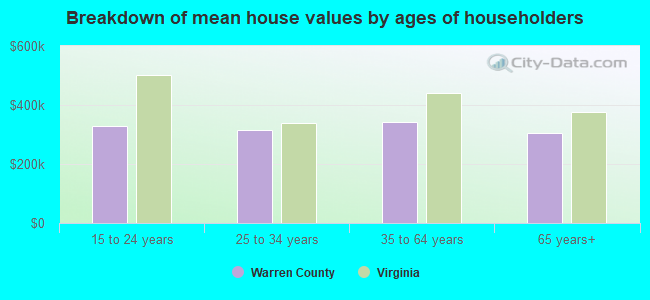
Estimated median house or condo value in 2022: $315,763 (it was $109,700 in 2000)
| Warren: | $315,763 |
| Virginia: | $365,700 |
Mean price in 2022:
Median monthly housing costs for homes and condos with a mortgage: $1,607Detached houses: $364,425
Here: $364,425 State: $472,865 Townhouses or other attached units: $640,108
Here: $640,108 State: $457,437 Mobile homes: $231,924
Here: $231,924 State: $100,736
Median monthly housing costs for units without a mortgage: $446
Institutionalized population: 365
Crime in 2021 (reported by the sheriff's office or county police, not the county total):
- Murders: 0
- Rapes: 11
- Robberies: 0
- Assaults: 10
- Burglaries: 12
- Thefts: 160
- Auto thefts: 19
Crime in 2020 (reported by the sheriff's office or county police, not the county total):
- Murders: 0
- Rapes: 16
- Robberies: 0
- Assaults: 3
- Burglaries: 17
- Thefts: 236
- Auto thefts: 10
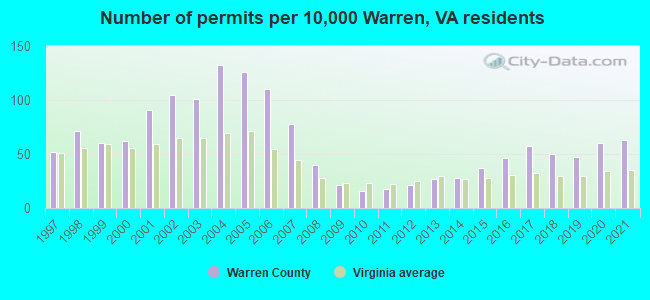
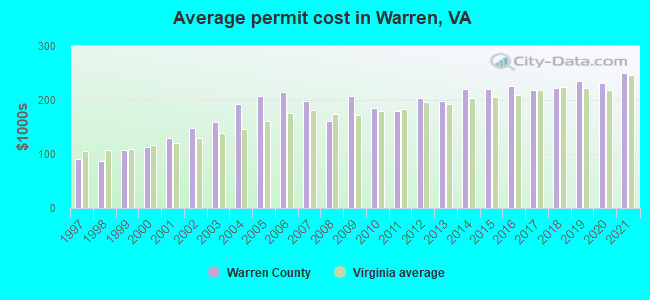
Single-family new house construction building permits:
- 2022: 156 buildings, average cost: $325,100
- 2021: 200 buildings, average cost: $249,600
- 2020: 191 buildings, average cost: $230,600
- 2019: 150 buildings, average cost: $235,800
- 2018: 158 buildings, average cost: $222,500
- 2017: 181 buildings, average cost: $219,100
- 2016: 145 buildings, average cost: $224,800
- 2015: 116 buildings, average cost: $219,600
- 2014: 87 buildings, average cost: $220,200
- 2013: 85 buildings, average cost: $198,700
- 2012: 66 buildings, average cost: $202,700
- 2011: 57 buildings, average cost: $178,900
- 2010: 50 buildings, average cost: $185,800
- 2009: 66 buildings, average cost: $207,400
- 2008: 127 buildings, average cost: $162,200
- 2007: 245 buildings, average cost: $198,200
- 2006: 348 buildings, average cost: $213,700
- 2005: 398 buildings, average cost: $207,300
- 2004: 416 buildings, average cost: $192,600
- 2003: 318 buildings, average cost: $159,800
- 2002: 331 buildings, average cost: $148,400
- 2001: 286 buildings, average cost: $128,800
- 2000: 197 buildings, average cost: $113,400
- 1999: 190 buildings, average cost: $107,200
- 1998: 224 buildings, average cost: $87,100
- 1997: 165 buildings, average cost: $89,500
Median real estate property taxes paid for housing units with mortgages in 2022: $1,850 (0.6%)
Median real estate property taxes paid for housing units with no mortgage in 2022: $1,594 (0.5%)
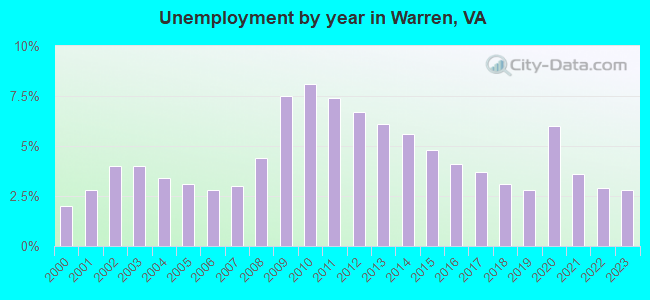
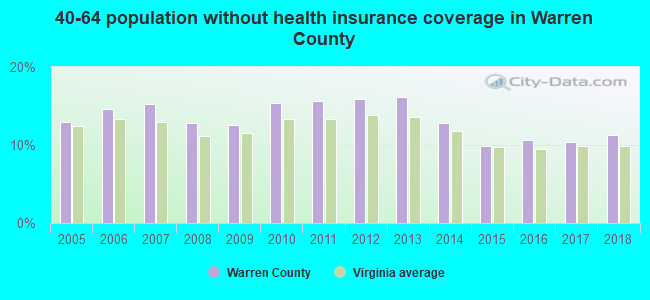
| Warren County: | 12.6% |
| Virginia: | 10.6% |
Median age of residents in 2022: 41.2 years old
(Males: 40.8 years old, Females: 41.7 years old)
(Median age for: White residents: 43.4 years old, Black residents: 36.4 years old, American Indian residents: 20.5 years old, Asian residents: 45.4 years old, Hispanic or Latino residents: 29.3 years old, Other race residents: 25.2 years old)
Fair market rent in 2006 for a 1-bedroom apartment in Warren County is $524 a month.
Fair market rent for a 2-bedroom apartment is $653 a month.
Fair market rent for a 3-bedroom apartment is $918 a month.
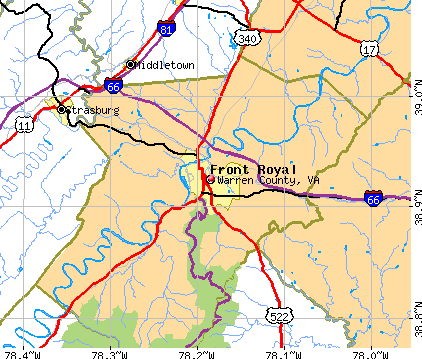
Cities in this county include: Front Royal, Shenandoah Farms, Apple Mountain Lake, Shenandoah Shores, Skyland Estates.
Neighboring counties: Calhoun County, Illinois  , Clark County, Indiana , Jackson County, Ohio , Ohio County, Indiana , Rockingham County
  , Wabaunsee County, Kansas .
| Here: | 2.7% |
| Virginia: | 2.7% |
Current college students: 1,085
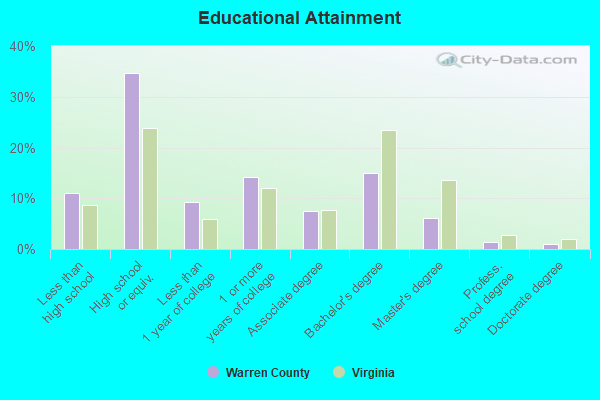
People 25 years of age or older with a high school degree or higher: 88.8%
People 25 years of age or older with a bachelor's degree or higher: 22.4%
Number of foreign born residents: 2,447 (53.4% naturalized citizens)
| Warren County: | 6.0% |
| Whole state: | 12.7% |
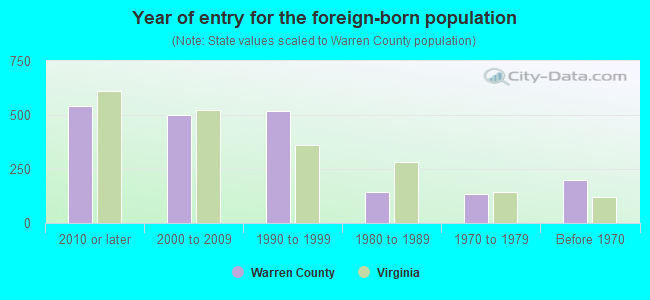
- Year of entry for the foreign-born population
- 6302010 or later
- 4782000 to 2009
- 5721990 to 1999
- 1431980 to 1989
- 1331970 to 1979
- 201Before 1970
Mean travel time to work (commute): & minutes
Percentage of county residents living and working in this county: 98.4%
Housing units in structures:
- One, detached: 14,278
- One, attached: 967
- Two: 253
- 3 or 4: 418
- 5 to 9: 304
- 10 to 19: 423
- 20 to 49: 138
- 50 or more: 40
- Mobile homes: 224
Housing units in Warren County with a mortgage: 8,329 (783 second mortgage, 39 home equity loan, 624 both second mortgage and home equity loan)
Houses without a mortgage: 291
| Here: | 2.7% with mortgage |
| State: | 97.2% with mortgage |
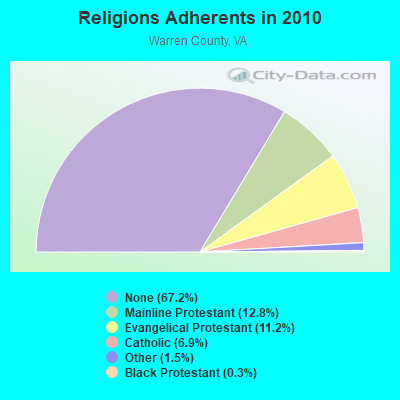
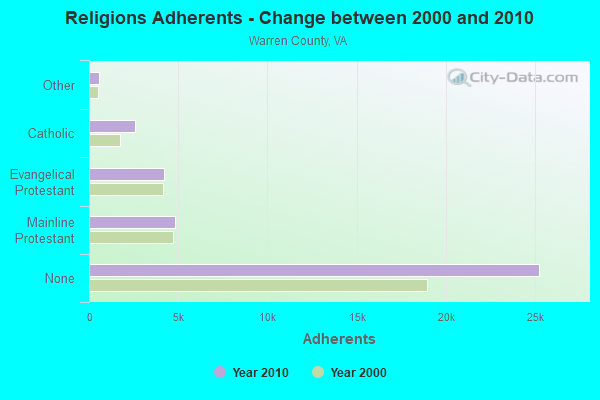
Religion statistics for Warren County
| Religion | Adherents | Congregations |
|---|---|---|
| Mainline Protestant | 4,810 | 18 |
| Evangelical Protestant | 4,222 | 24 |
| Catholic | 2,597 | 1 |
| Other | 574 | 4 |
| Black Protestant | 123 | 1 |
| None | 25,249 | - |
Source: Clifford Grammich, Kirk Hadaway, Richard Houseal, Dale E.Jones, Alexei Krindatch, Richie Stanley and Richard H.Taylor. 2012. 2010 U.S.Religion Census: Religious Congregations & Membership Study. Association of Statisticians of American Religious Bodies. Jones, Dale E., et al. 2002. Congregations and Membership in the United States 2000. Nashville, TN: Glenmary Research Center.
Food Environment Statistics:
| Warren County: | 1.38 / 10,000 pop. |
| State: | 2.03 / 10,000 pop. |
| This county: | 2.48 / 10,000 pop. |
| Virginia: | 1.43 / 10,000 pop. |
| Warren County: | 5.52 / 10,000 pop. |
| Virginia: | 4.03 / 10,000 pop. |
| This county: | 7.72 / 10,000 pop. |
| State: | 7.65 / 10,000 pop. |
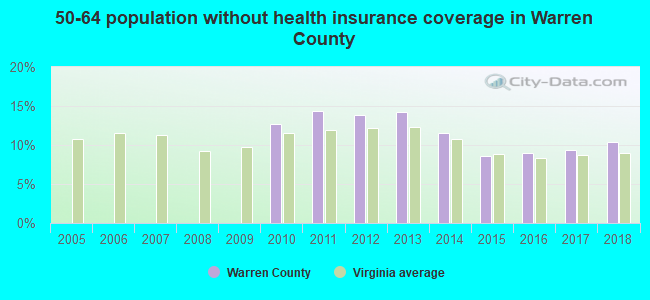
| Warren County: | 9.4% |
| Virginia: | 9.3% |
| Warren County: | 29.7% |
| State: | 26.7% |
| Here: | 12.0% |
| State: | 18.6% |
Agriculture in Warren County:
Average size of farms: 136 acresAverage value of agricultural products sold per farm: $15,376
Average value of crops sold per acre for harvested cropland: $99.40
The value of nursery, greenhouse, floriculture, and sod as a percentage of the total market value of agricultural products sold: 4.49%
The value of livestock, poultry, and their products as a percentage of the total market value of agricultural products sold: 81.25%
Average total farm production expenses per farm: $13,323
Harvested cropland as a percentage of land in farms: 21.39%
Irrigated harvested cropland as a percentage of land in farms: 1.36%
Average market value of all machinery and equipment per farm: $31,456
The percentage of farms operated by a family or individual: 92.24%
Average age of principal farm operators: 59 years
Average number of cattle and calves per 100 acres of all land in farms: 17.96
Milk cows as a percentage of all cattle and calves: 0.03%
Corn for grain: 344 harvested acres
All wheat for grain: 79 harvested acres
Land in orchards: 574 acres
Earthquake activity:
Warren County-area historical earthquake activity is significantly above Virginia state average. It is 51% smaller than the overall U.S. average.On 8/23/2011 at 17:51:04, a magnitude 5.8 (5.8 MW, Depth: 3.7 mi, Class: Moderate, Intensity: VI - VII) earthquake occurred 71.5 miles away from Warren County center
On 8/25/2011 at 05:07:52, a magnitude 4.5 (4.5 ML, Depth: 4.2 mi, Class: Light, Intensity: IV - V) earthquake occurred 68.7 miles away from the county center
On 9/25/1998 at 19:52:52, a magnitude 5.2 (4.8 MB, 4.3 MS, 5.2 LG, 4.5 MW, Depth: 3.1 mi) earthquake occurred 212.5 miles away from the county center
On 12/9/2003 at 20:59:18, a magnitude 4.5 (4.5 ML, Depth: 6.2 mi) earthquake occurred 79.7 miles away from the county center
On 12/9/2003 at 20:59:14, a magnitude 4.5 (4.5 MB, 4.5 LG) earthquake occurred 93.8 miles away from Warren County center
On 8/9/2020 at 12:07:37, a magnitude 5.1 (5.1 MW, Depth: 4.7 mi) earthquake occurred 232.5 miles away from the county center
Magnitude types: regional Lg-wave magnitude (LG), body-wave magnitude (MB), local magnitude (ML), surface-wave magnitude (MS), moment magnitude (MW)
Most recent natural disasters:
- Virginia Covid-19 Pandemic, Incident Period: January 20, 2020, Major Disaster (Presidential) Declared DR-4512-VA: April 2, 2020, FEMA Id: 4512, Natural disaster type: Other
- Virginia Severe Winter Storm And Snowstorm, Incident Period: January 22, 2016 to January 23, 2016, Major Disaster (Presidential) Declared DR-4262: March 07, 2016, FEMA Id: 4262, Natural disaster type: Snowstorm, Winter Storm
- Virginia Hurricane Sandy, Incident Period: October 26, 2012 to November 01, 2012, Emergency Declared EM-3359: October 29, 2012, FEMA Id: 3359, Natural disaster type: Hurricane
- Virginia Severe Storms and Straight-line Winds, Incident Period: June 29, 2012 to July 01, 2012, Major Disaster (Presidential) Declared DR-4072: July 27, 2012, FEMA Id: 4072, Natural disaster type: Storm, Wind
- Virginia Smith Fire, Incident Period: February 19, 2011 to December 31, 1969, Fire Management Assistance Declared: February 20, 2011, FEMA Id: 2860, Natural disaster type: Fire
- Virginia Severe Winter Storms and Snowstorms, Incident Period: February 05, 2010 to February 11, 2010, Major Disaster (Presidential) Declared DR-1905: April 27, 2010, FEMA Id: 1905, Natural disaster type: Snowstorm, Winter Storm
- Virginia Hurricane Katrina Evacuation, Incident Period: August 29, 2005 to October 01, 2005, Emergency Declared EM-3240: September 12, 2005, FEMA Id: 3240, Natural disaster type: Hurricane
- Virginia Hurricane Isabel, Incident Period: September 18, 2003 to October 01, 2003, Major Disaster (Presidential) Declared DR-1491: September 18, 2003, FEMA Id: 1491, Natural disaster type: Hurricane
- Virginia Winter Storm, Incident Period: January 25, 2000 to January 30, 2000, Major Disaster (Presidential) Declared DR-1318: February 28, 2000, FEMA Id: 1318, Natural disaster type: Winter Storm
- Virginia Hurricane Fran, Incident Period: September 05, 1996 to September 23, 1996, Major Disaster (Presidential) Declared DR-1135: September 06, 1996, FEMA Id: 1135, Natural disaster type: Hurricane
- 8 other natural disasters have been reported since 1953.
The number of natural disasters in Warren County (18) is near the US average (15).
Major Disasters (Presidential) Declared: 13
Emergencies Declared: 4
Causes of natural disasters: Floods: 4, Hurricanes: 4, Storms: 4, Winter Storms: 4, Snowstorms: 2, Blizzard: 1, Drought: 1, Fire: 1, Tropical Storm: 1, Wind: 1, Other: 1 (Note: some incidents may be assigned to more than one category).
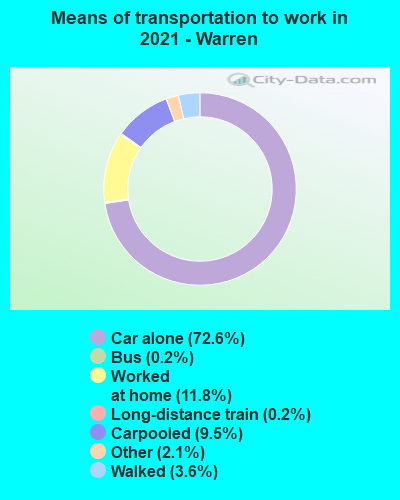
Means of transportation to work:
- Drove a car alone: 11,165 (68.7%)
- Carpooled: 1,421 (8.7%)
- Bus: 21 (0.1%)
- Long-distance train or commuter rail: 3 (0.0%)
- Ferryboat: 14 (0.1%)
- Taxicab, motorcycle, or other means: 352 (2.2%)
- Walked: 594 (3.7%)
- Worked at home: 2,755 (16.9%)
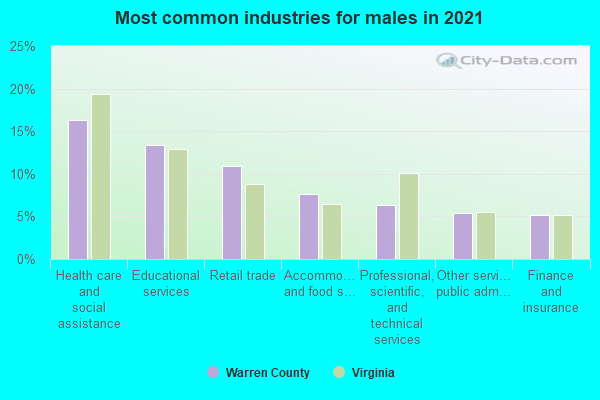
- Health care and social assistance (16%)
- Educational services (13%)
- Retail trade (11%)
- Professional, scientific, and technical services (6%)
- Accommodation and food services (6%)
- Other services, except public administration (6%)
- Finance and insurance (4%)
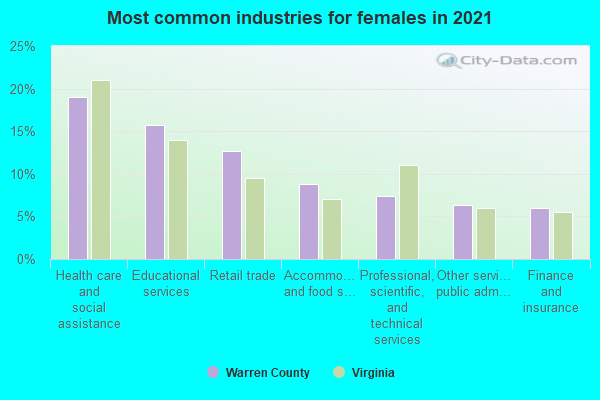
- Health care and social assistance (19%)
- Educational services (15%)
- Retail trade (13%)
- Professional, scientific, and technical services (7%)
- Accommodation and food services (7%)
- Other services, except public administration (7%)
- Finance and insurance (5%)
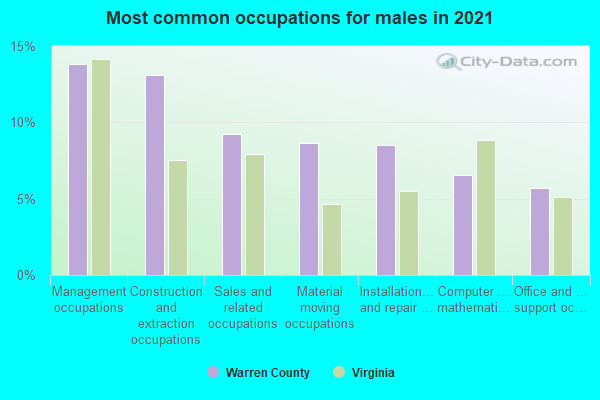
- Construction and extraction occupations (13%)
- Management occupations (13%)
- Sales and related occupations (10%)
- Computer and mathematical occupations (7%)
- Material moving occupations (7%)
- Installation, maintenance, and repair occupations (6%)
- Office and administrative support occupations (5%)
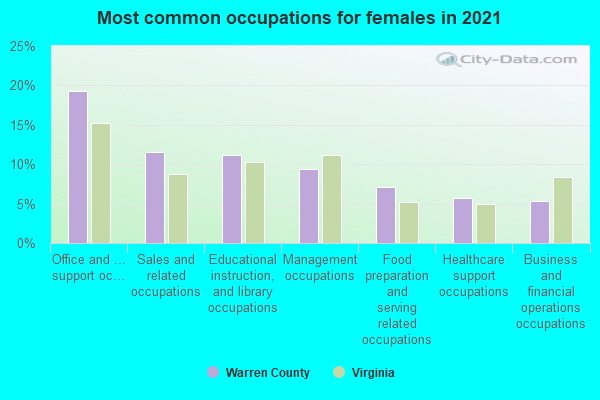
- Office and administrative support occupations (19%)
- Sales and related occupations (12%)
- Management occupations (11%)
- Educational instruction, and library occupations (11%)
- Business and financial operations occupations (6%)
- Healthcare support occupations (6%)
- Food preparation and serving related occupations (6%)
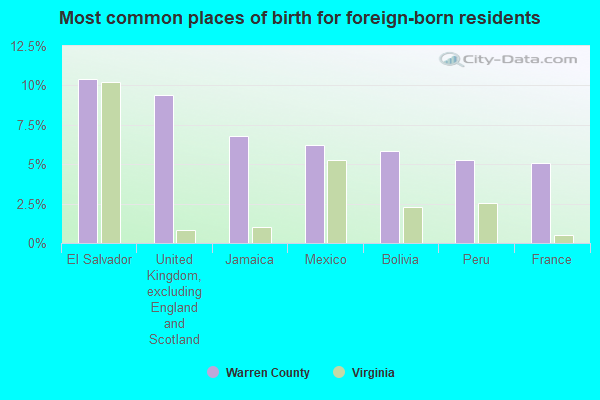
- El Salvador (16%)
- United Kingdom, excluding England and Scotland (6%)
- Bolivia (6%)
- Mexico (6%)
- Pakistan (5%)
- Jamaica (5%)
- Peru (5%)
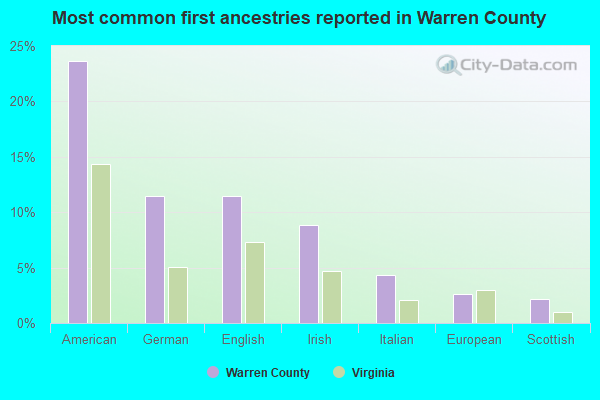
- American (18%)
- German (12%)
- Irish (10%)
- English (9%)
- Italian (4%)
- Scottish (3%)
- European (3%)
People in group quarters in Warren County, Virginia in 2010:
- 312 people in college/university student housing
- 239 people in nursing facilities/skilled-nursing facilities
- 126 people in local jails and other municipal confinement facilities
- 18 people in emergency and transitional shelters (with sleeping facilities) for people experiencing homelessness
- 17 people in workers' group living quarters and job corps centers
- 7 people in other noninstitutional facilities
- 6 people in group homes intended for adults
People in group quarters in Warren County, Virginia in 2000:
- 231 people in college dormitories (includes college quarters off campus)
- 206 people in nursing homes
- 67 people in local jails and other confinement facilities (including police lockups)
- 29 people in other workers' dormitories
- 11 people in other noninstitutional group quarters
- 2 people in other nonhousehold living situations
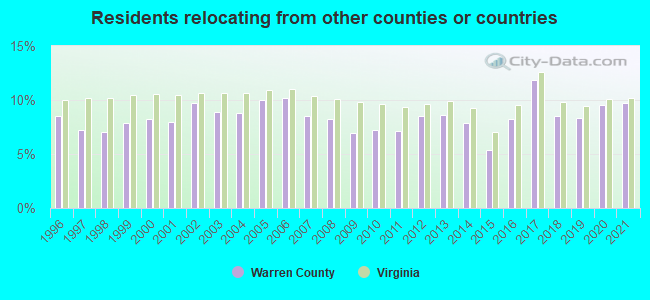
9.70% of this county's 2021 resident taxpayers lived in other counties in 2020 ($67,144 average adjusted gross income)
| Here: | 9.70% |
| Virginia average: | 10.16% |
10 or fewer of this county's residents moved from foreign countries.
7.13% relocated from other counties in Virginia ($50,839 average AGI)
2.56% relocated from other states ($16,305 average AGI)
Warren County: 2.56% Virginia average: 3.91%
Top counties from which taxpayers relocated into this county between 2020 and 2021:
| from Prince William County, VA | |
| from Fairfax County, VA | |
| from Shenandoah County, VA | |
| from Frederick County, VA | |
| from Loudoun County, VA | |
| from Fauquier County, VA | |
| from Winchester city, VA |
8.50% of this county's 2020 resident taxpayers moved to other counties in 2021 ($61,080 average adjusted gross income)
| Here: | 8.50% |
| Virginia average: | 10.20% |
10 or fewer of this county's residents moved to foreign countries.
5.56% relocated to other counties in Virginia ($39,322 average AGI)
2.94% relocated to other states ($21,758 average AGI)
Warren County: 2.94% Virginia average: 3.98%

Top counties to which taxpayers relocated from this county between 2020 and 2021:
| to Frederick County, VA | |
| to Shenandoah County, VA | |
| to Winchester city, VA | |
| to Fairfax County, VA | |
| to Fauquier County, VA | |
| to Prince William County, VA | |
| to Berkeley County, WV |
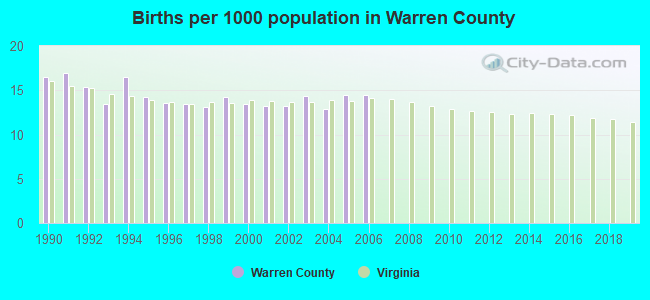
Births per 1000 population from 1990 to 1999: 14.7
Births per 1000 population from 2000 to 2006: 13.7
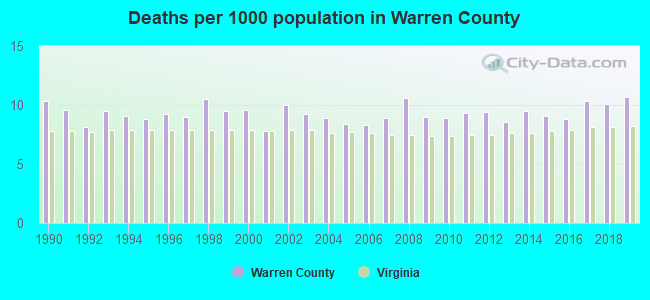
Deaths per 1000 population from 1990 to 1999: 9.4
Deaths per 1000 population from 2000 to 2009: 9.1
Deaths per 1000 population from 2010 to 2020: 9.6
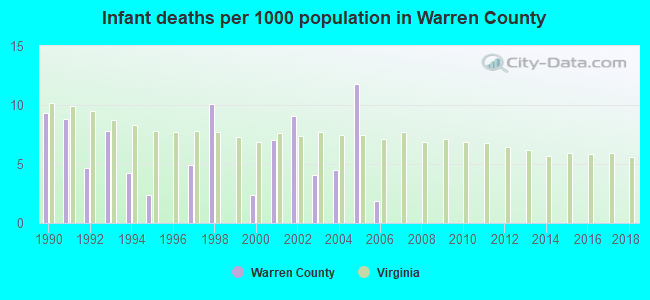
Infant deaths per 1000 live births from 1990 to 1999: 5.2
Infant deaths per 1000 live births from 2000 to 2006: 5.8
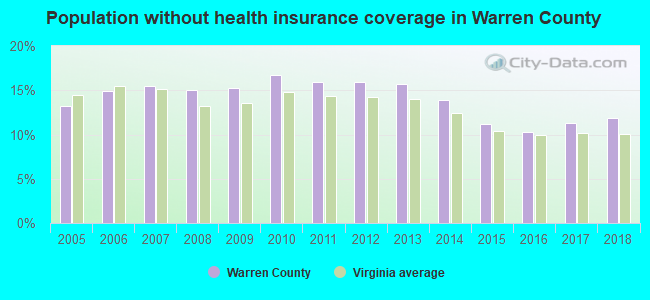
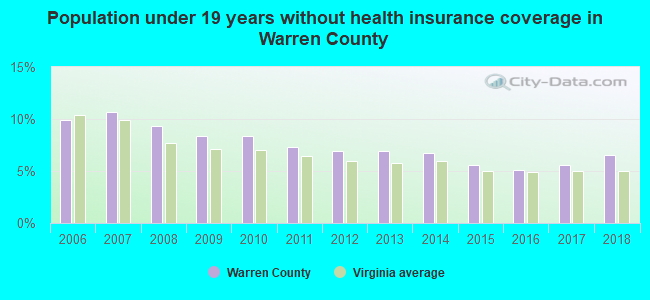
Persons under 19 years old without health insurance coverage in 2018: 6.5%
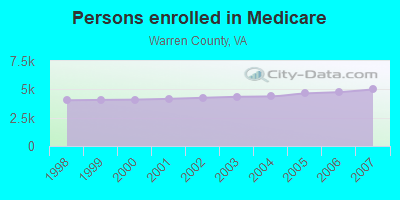
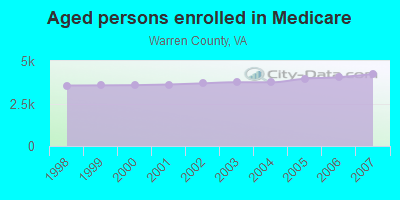
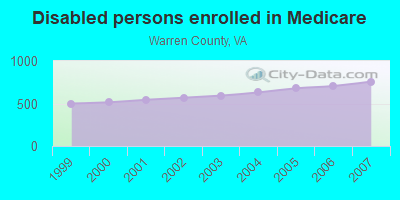
Persons enrolled in hospital insurance and/or supplemental medical insurance (Medicare) in July 1, 2007: 4,995 (4,237 aged, 758 disabled)
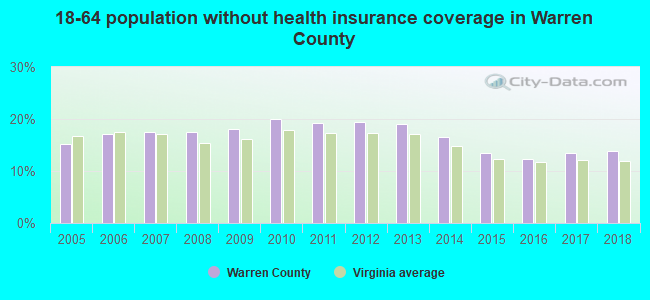
Children under 18 without health insurance coverage in 2007: 944 (10%)
Most common underlying causes of death in Warren County, Virginia in 1999 - 2019:
- Bronchus or lung, unspecified - Malignant neoplasms (509)
- Chronic obstructive pulmonary disease, unspecified (343)
- Atherosclerotic heart disease (326)
- Acute myocardial infarction, unspecified (316)
- Unspecified dementia (260)
- Alzheimer disease, unspecified (198)
- Stroke, not specified as haemorrhage or infarction (167)
- Congestive heart failure (140)
- Atherosclerotic cardiovascular disease, so described (88)
- Breast, unspecified - Malignant neoplasms (22)
Population without health insurance coverage in 2000: 11%
Children under 18 without health insurance coverage in 2000: 8%
Short term general hospital admissions per 100,000 population in 2004: 9,012
Short term general hospital beds per 100,000 population in 2004: 483
Emergency room visits per 100,000 population in 2004: 67,923
General practice office based MDs per 100,000 population in 2005: 1,249
Medical specialist MDs per 100,000 population in 2005: 903
Dentists per 100,000 population in 1998: 3
Total births per 100,000 population, July 2005 - July 2006 : 23
Total deaths per 100,000 population, July 2005 - July 2006: 65
Limited-service eating places per 100,000 population in 2005 : 14
Suicides per 1,000,000 population from 2000 to 2006: 170.4. This is more than state average.
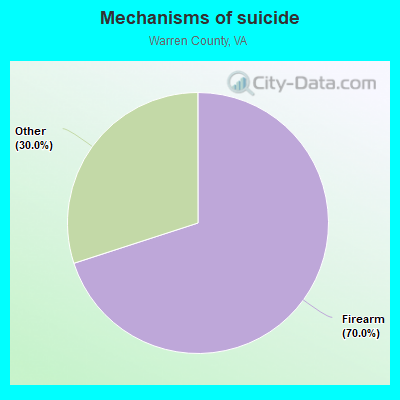
- Firearm - 119.3
- Other - 51.1
Household type by relationship:
Households: 41,079- Male householders: 8,437 (1,980 living alone), Female householders: 7,208 (1,771 living alone)
8,362 spouses (8,330 opposite-sex spouses), 1,416 unmarried partners, (1,321 opposite-sex unmarried partners), 11,228 children (10,620 natural, 75 adopted, 550 stepchildren), 945 grandchildren, 528 brothers or sisters, 379 parents, 0 foster children, 810 other relatives, 960 non-relatives
- In group quarters: 815
Size of family households: 4,487 2-persons, 2,620 3-persons, 1,905 4-persons, 1,140 5-persons, 370 6-persons, 249 7-or-more-persons.
Size of nonfamily households: 3,749 1-person, 974 2-persons, 102 3-persons, 42 4-persons.
5,529 married couples with children.
2,343 single-parent households (822 men, 1,521 women).
93.2% of residents of Warren speak English at home.
4.3% of residents speak Spanish at home (82% speak English very well, 10% speak English well, 5% speak English not well, 2% don't speak English at all).
1.6% of residents speak other Indo-European language at home (43% speak English very well, 38% speak English well, 10% speak English not well, 9% don't speak English at all).
0.6% of residents speak Asian or Pacific Island language at home (51% speak English very well, 30% speak English well, 19% speak English not well).
0.2% of residents speak other language at home (100% speak English very well).
In fiscal year 2004:
Federal Government expenditure: $144,850,000 ($4,214 per capita)
Department of Defense expenditure: $12,422,000
Federal direct payments to individuals for retirement and disability: $86,869,000
Federal other direct payments to individuals: $25,714,000
Federal direct payments not to individuals: $221,000
Federal grants: $12,647,000
Federal procurement contracts: $8,178,000 ($3,764,000 Department of Defense)
Federal salaries and wages: $11,221,000 ($80,000 Department of Defense)
Federal Government direct loans: $355,000
Federal guaranteed/insured loans: $50,613,000
Federal Government insurance: $42,979,000
Population change from April 1, 2000 to July 1, 2005:
Births: 2,384| Here: | 67 per 1000 residents |
| State: | 70 per 1000 residents |
Deaths: 1,588
| Here: | 45 per 1000 residents |
| State: | 40 per 1000 residents |
Net international migration: +38
| Here: | +1 per 1000 residents |
| State: | +18 per 1000 residents |
Net internal migration: +3,196
| Here: | +90 per 1000 residents |
| State: | +14 per 1000 residents |
Total withdrawal of fresh water for public supply: 9.39 millions of gallons per day (1% from ground, 99% from surface)
| Here: | 6.5 |
| State: | 7.0 |
| Here: | 4.5 |
| State: | 4.3 |
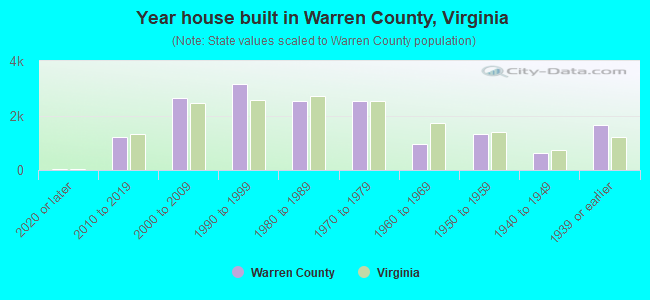
- Year house built in Warren County, Virginia
- 1012020 or later
- 1,1382010 to 2019
- 2,6152000 to 2009
- 3,0491990 to 1999
- 2,4331980 to 1989
- 2,6461970 to 1979
- 9121960 to 1969
- 1,3321950 to 1959
- 7151940 to 1949
- 1,8281939 or earlier
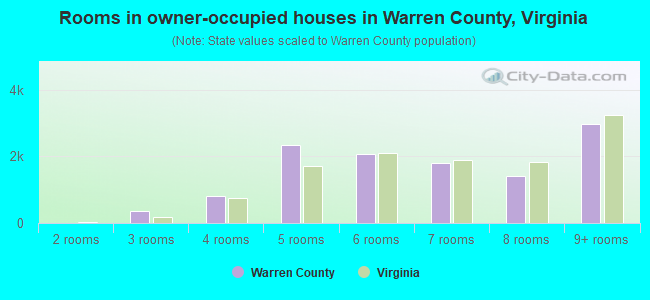
- Rooms in owner-occupied houses in Warren County, Virginia
- 81 room
- 02 rooms
- 3703 rooms
- 8054 rooms
- 2,3425 rooms
- 2,2406 rooms
- 1,7627 rooms
- 1,3148 rooms
- 2,8289+ rooms
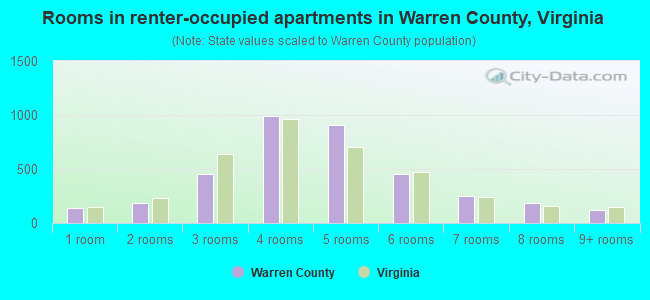
- Rooms in renter-occupied apartments in Warren County, Virginia
- 1751 room
- 1912 rooms
- 4683 rooms
- 1,0604 rooms
- 9125 rooms
- 4866 rooms
- 3187 rooms
- 1658 rooms
- 1869+ rooms
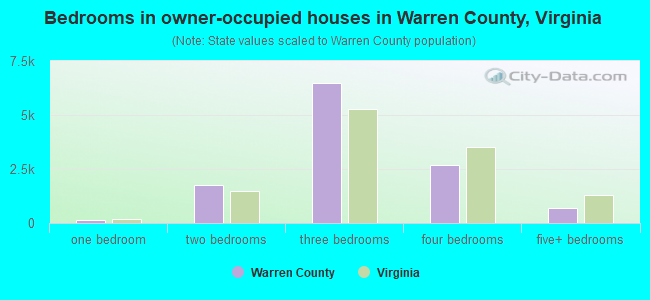
- Bedrooms in owner-occupied houses in Warren County, Virginia
- 9no bedroom
- 1001 bedroom
- 1,6642 bedrooms
- 6,7423 bedrooms
- 2,4884 bedrooms
- 6755+ bedrooms
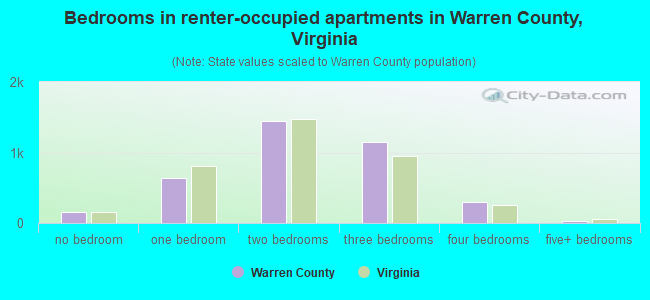
- Bedrooms in renter-occupied apartments in Warren County, Virginia
- 187no bedroom
- 7111 bedroom
- 1,3152 bedrooms
- 1,3823 bedrooms
- 3534 bedrooms
- 235+ bedrooms
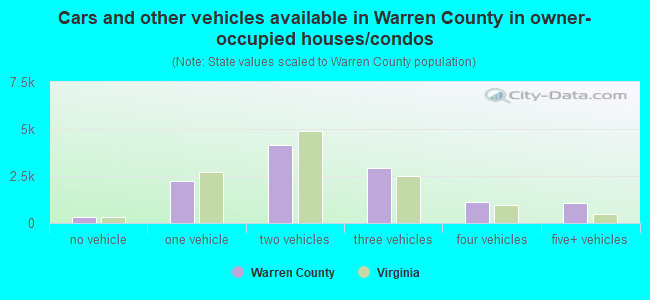
- Cars and other vehicles available in Warren County in owner-occupied houses/condos
- 307no vehicle
- 2,3651 vehicle
- 4,0332 vehicles
- 3,1583 vehicles
- 9994 vehicles
- 8105+ vehicles
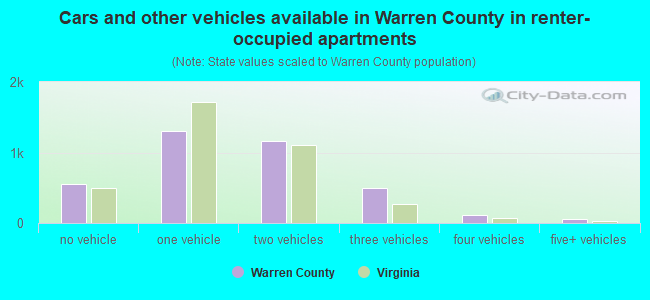
- Cars and other vehicles available in Warren County in renter-occupied apartments
- 559no vehicle
- 1,6461 vehicle
- 1,0172 vehicles
- 5173 vehicles
- 1754 vehicles
- 475+ vehicles
89.1% of Warren County residents lived in the same house 1 years ago.
Out of people who lived in different houses, 26% lived in this county.
Out of people who lived in different counties, 77% lived in Virginia.
| Warren County: | 89.1% |
| State average: | 86.6% |
Place of birth for U.S.-born residents:
- This state: 23,672
- Other state: 14,153
- Northeast: 4,122
- Midwest: 2,323
- South: 6,078
- West: 1,619
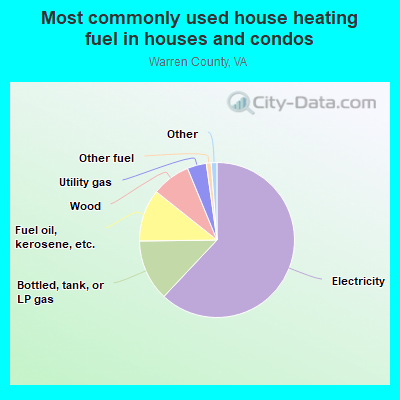
- 61.4%Electricity
- 13.4%Bottled, tank, or LP gas
- 10.9%Fuel oil, kerosene, etc.
- 7.9%Wood
- 4.6%Utility gas
- 0.8%Other fuel
- 0.7%No fuel used
- 0.3%Coal or coke
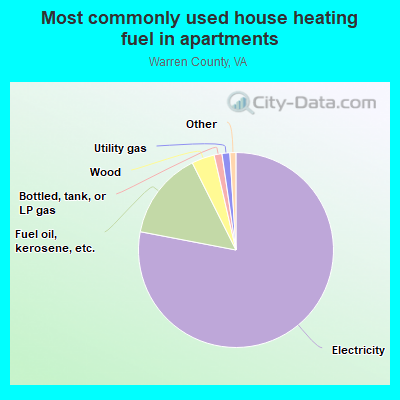
- 78.4%Electricity
- 12.0%Fuel oil, kerosene, etc.
- 4.0%Wood
- 3.3%Bottled, tank, or LP gas
- 1.2%Utility gas
- 0.9%No fuel used
- 0.2%Other fuel
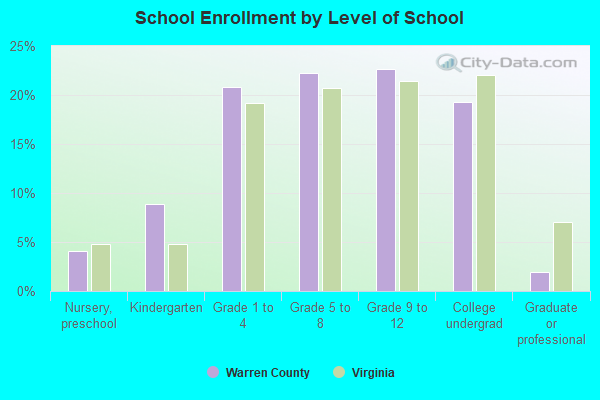
Private vs. public school enrollment:
| Here: | 14.0% |
| Virginia: | 13.2% |
| Here: | 8.2% |
| Virginia: | 10.2% |
| Here: | 50.8% |
| Virginia: | 18.7% |
Warren County government finances - Expenditure in 2020:
- Assistance and Subsidies - Public Welfare, Federal Categorical Assistance Programs: $5,707,000
- Charges - Other: $9,621,000
Elementary and Secondary Education School Lunch: $1,357,000
Elementary and Secondary Education School Lunch: $1,184,000
Solid Waste Management: $1,093,000
Solid Waste Management: $1,067,000
Parks and Recreation: $298,000
Parks and Recreation: $262,000
Air Transportation: $176,000
Air Transportation: $172,000
Sewerage: $82,000
Sewerage: $78,000
Elementary and Secondary Education - Other: $41,000
Elementary and Secondary Education - Other: $27,000
Sea and Inland Port Facilities: $20,000
Sea and Inland Port Facilities: $20,000
Elementary and Secondary Education School Tuition and Transportation: $15,000
Elementary and Secondary Education School Tuition and Transportation: $11,000
Miscellaneous Commercial Activities: $3,000
Natural Resources - Other: $2,000
- Construction - Elementary and Secondary Education: $3,580,000
Elementary and Secondary Education: $1,107,000
Air Transportation: $501,000
Air Transportation: $194,000
Libraries: $53,000
Libraries: $53,000
- Current Operations - Elementary and Secondary Education: $61,472,000
Elementary and Secondary Education: $54,468,000
Health - Other: $20,304,000
Police Protection: $6,107,000
Public Welfare - Other: $5,650,000
Police Protection: $5,372,000
Local Fire Protection: $4,722,000
Local Fire Protection: $4,247,000
Solid Waste Management: $3,389,000
Solid Waste Management: $2,940,000
Parks and Recreation: $2,823,000
Judicial and Legal Services: $2,797,000
Judicial and Legal Services: $2,490,000
Parks and Recreation: $2,483,000
Central Staff Services: $2,147,000
Financial Administration: $1,554,000
Financial Administration: $1,488,000
Central Staff Services: $1,417,000
General Public Buildings: $1,276,000
General - Other: $1,272,000
General - Other: $1,138,000
Libraries: $1,022,000
Libraries: $945,000
General Public Buildings: $941,000
Protective Inspection and Regulation - Other: $679,000
Protective Inspection and Regulation - Other: $564,000
Public Welfare - Other: $456,000
Health - Other: $344,000
Air Transportation: $187,000
Air Transportation: $102,000
Corrections - Other: $66,000
Corrections - Other: $62,000
Regular Highways: $18,000
Regular Highways: $9,000
- Federal Intergovernmental - Health and Hospitals: $352,000
Education: $4,000
- General - Interest on Debt: $5,803,000
Interest on Debt: $5,436,000
- Intergovernmental to Local - Other - Elementary and Secondary Education: $173,000
Other - Elementary and Secondary Education: $149,000
- Local Intergovernmental - Public Welfare: $2,969,000
Public Welfare: $2,754,000
Health and Hospitals: $1,365,000
Education: $696,000
Education: $593,000
Other: $502,000
Other: $187,000
General Local Government Support: $56,000
General Local Government Support: $53,000
- Long Term Debt - Beginning Outstanding - Unspecified Public Purpose: $159,991,000
Beginning Outstanding - Unspecified Public Purpose: $145,064,000
Outstanding Unspecified Public Purpose: $140,165,000
Outstanding Unspecified Public Purpose: $139,596,000
Retired Unspecified Public Purpose: $19,826,000
Retired Unspecified Public Purpose: $5,468,000
- Miscellaneous - Interest Earnings: $467,000
Rents: $363,000
Rents: $350,000
General Revenue - Other: $340,000
General Revenue - Other: $232,000
Fines and Forfeits: $104,000
Fines and Forfeits: $91,000
Interest Earnings: $26,000
Donations From Private Sources: $22,000
Sale of Property: $7,000
Sale of Property: $5,000
Donations From Private Sources: $2,000
- Other Capital Outlay - Elementary and Secondary Education: $23,114,000
Correctional Institutions: $4,404,000
Correctional Institutions: $3,469,000
Elementary and Secondary Education: $1,632,000
Health - Other: $74,000
- Other Funds - Cash and Securities: $34,573,000
Cash and Securities: $31,582,000
- Sinking Funds - Cash and Securities: $221,000
- State Intergovernmental - Education: $34,385,000
Education: $32,229,000
Health and Hospitals: $8,461,000
General Local Government Support: $4,581,000
General Local Government Support: $4,541,000
- Tax - Property: $51,499,000
Property: $45,971,000
General Sales and Gross Receipts: $4,548,000
General Sales and Gross Receipts: $4,056,000
Motor Vehicle License: $926,000
Motor Vehicle License: $871,000
Occupation and Business License - Other: $859,000
Occupation and Business License - Other: $837,000
Public Utilities Sales: $764,000
Public Utilities Sales: $761,000
Other License: $350,000
Other License: $307,000
- Total Salaries and Wages: $34,765,000
: $32,242,000
Warren County government finances - Revenue in 2020:
- Assistance and Subsidies - Public Welfare, Federal Categorical Assistance Programs: $5,707,000
- Charges - Other: $9,621,000
Elementary and Secondary Education School Lunch: $1,357,000
Elementary and Secondary Education School Lunch: $1,184,000
Solid Waste Management: $1,093,000
Solid Waste Management: $1,067,000
Parks and Recreation: $298,000
Parks and Recreation: $262,000
Air Transportation: $176,000
Air Transportation: $172,000
Sewerage: $82,000
Sewerage: $78,000
Elementary and Secondary Education - Other: $41,000
Elementary and Secondary Education - Other: $27,000
Sea and Inland Port Facilities: $20,000
Sea and Inland Port Facilities: $20,000
Elementary and Secondary Education School Tuition and Transportation: $15,000
Elementary and Secondary Education School Tuition and Transportation: $11,000
Miscellaneous Commercial Activities: $3,000
Natural Resources - Other: $2,000
- Construction - Elementary and Secondary Education: $3,580,000
Elementary and Secondary Education: $1,107,000
Air Transportation: $501,000
Air Transportation: $194,000
Libraries: $53,000
Libraries: $53,000
- Current Operations - Elementary and Secondary Education: $61,472,000
Elementary and Secondary Education: $54,468,000
Health - Other: $20,304,000
Police Protection: $6,107,000
Public Welfare - Other: $5,650,000
Police Protection: $5,372,000
Local Fire Protection: $4,722,000
Local Fire Protection: $4,247,000
Solid Waste Management: $3,389,000
Solid Waste Management: $2,940,000
Parks and Recreation: $2,823,000
Judicial and Legal Services: $2,797,000
Judicial and Legal Services: $2,490,000
Parks and Recreation: $2,483,000
Central Staff Services: $2,147,000
Financial Administration: $1,554,000
Financial Administration: $1,488,000
Central Staff Services: $1,417,000
General Public Buildings: $1,276,000
General - Other: $1,272,000
General - Other: $1,138,000
Libraries: $1,022,000
Libraries: $945,000
General Public Buildings: $941,000
Protective Inspection and Regulation - Other: $679,000
Protective Inspection and Regulation - Other: $564,000
Public Welfare - Other: $456,000
Health - Other: $344,000
Air Transportation: $187,000
Air Transportation: $102,000
Corrections - Other: $66,000
Corrections - Other: $62,000
Regular Highways: $18,000
Regular Highways: $9,000
- Federal Intergovernmental - Health and Hospitals: $352,000
Education: $4,000
- General - Interest on Debt: $5,803,000
Interest on Debt: $5,436,000
- Intergovernmental to Local - Other - Elementary and Secondary Education: $173,000
Other - Elementary and Secondary Education: $149,000
- Local Intergovernmental - Public Welfare: $2,969,000
Public Welfare: $2,754,000
Health and Hospitals: $1,365,000
Education: $696,000
Education: $593,000
Other: $502,000
Other: $187,000
General Local Government Support: $56,000
General Local Government Support: $53,000
- Long Term Debt - Beginning Outstanding - Unspecified Public Purpose: $159,991,000
Beginning Outstanding - Unspecified Public Purpose: $145,064,000
Outstanding Unspecified Public Purpose: $140,165,000
Outstanding Unspecified Public Purpose: $139,596,000
Retired Unspecified Public Purpose: $19,826,000
Retired Unspecified Public Purpose: $5,468,000
- Miscellaneous - Interest Earnings: $467,000
Rents: $363,000
Rents: $350,000
General Revenue - Other: $340,000
General Revenue - Other: $232,000
Fines and Forfeits: $104,000
Fines and Forfeits: $91,000
Interest Earnings: $26,000
Donations From Private Sources: $22,000
Sale of Property: $7,000
Sale of Property: $5,000
Donations From Private Sources: $2,000
- Other Capital Outlay - Elementary and Secondary Education: $23,114,000
Correctional Institutions: $4,404,000
Correctional Institutions: $3,469,000
Elementary and Secondary Education: $1,632,000
Health - Other: $74,000
- Other Funds - Cash and Securities: $34,573,000
Cash and Securities: $31,582,000
- Sinking Funds - Cash and Securities: $221,000
- State Intergovernmental - Education: $34,385,000
Education: $32,229,000
Health and Hospitals: $8,461,000
General Local Government Support: $4,581,000
General Local Government Support: $4,541,000
- Tax - Property: $51,499,000
Property: $45,971,000
General Sales and Gross Receipts: $4,548,000
General Sales and Gross Receipts: $4,056,000
Motor Vehicle License: $926,000
Motor Vehicle License: $871,000
Occupation and Business License - Other: $859,000
Occupation and Business License - Other: $837,000
Public Utilities Sales: $764,000
Public Utilities Sales: $761,000
Other License: $350,000
Other License: $307,000
- Total Salaries and Wages: $34,765,000
: $32,242,000
Warren County government finances - Debt in 2020:
- Assistance and Subsidies - Public Welfare, Federal Categorical Assistance Programs: $5,707,000
- Charges - Other: $9,621,000
Elementary and Secondary Education School Lunch: $1,357,000
Elementary and Secondary Education School Lunch: $1,184,000
Solid Waste Management: $1,093,000
Solid Waste Management: $1,067,000
Parks and Recreation: $298,000
Parks and Recreation: $262,000
Air Transportation: $176,000
Air Transportation: $172,000
Sewerage: $82,000
Sewerage: $78,000
Elementary and Secondary Education - Other: $41,000
Elementary and Secondary Education - Other: $27,000
Sea and Inland Port Facilities: $20,000
Sea and Inland Port Facilities: $20,000
Elementary and Secondary Education School Tuition and Transportation: $15,000
Elementary and Secondary Education School Tuition and Transportation: $11,000
Miscellaneous Commercial Activities: $3,000
Natural Resources - Other: $2,000
- Construction - Elementary and Secondary Education: $3,580,000
Elementary and Secondary Education: $1,107,000
Air Transportation: $501,000
Air Transportation: $194,000
Libraries: $53,000
Libraries: $53,000
- Current Operations - Elementary and Secondary Education: $61,472,000
Elementary and Secondary Education: $54,468,000
Health - Other: $20,304,000
Police Protection: $6,107,000
Public Welfare - Other: $5,650,000
Police Protection: $5,372,000
Local Fire Protection: $4,722,000
Local Fire Protection: $4,247,000
Solid Waste Management: $3,389,000
Solid Waste Management: $2,940,000
Parks and Recreation: $2,823,000
Judicial and Legal Services: $2,797,000
Judicial and Legal Services: $2,490,000
Parks and Recreation: $2,483,000
Central Staff Services: $2,147,000
Financial Administration: $1,554,000
Financial Administration: $1,488,000
Central Staff Services: $1,417,000
General Public Buildings: $1,276,000
General - Other: $1,272,000
General - Other: $1,138,000
Libraries: $1,022,000
Libraries: $945,000
General Public Buildings: $941,000
Protective Inspection and Regulation - Other: $679,000
Protective Inspection and Regulation - Other: $564,000
Public Welfare - Other: $456,000
Health - Other: $344,000
Air Transportation: $187,000
Air Transportation: $102,000
Corrections - Other: $66,000
Corrections - Other: $62,000
Regular Highways: $18,000
Regular Highways: $9,000
- Federal Intergovernmental - Health and Hospitals: $352,000
Education: $4,000
- General - Interest on Debt: $5,803,000
Interest on Debt: $5,436,000
- Intergovernmental to Local - Other - Elementary and Secondary Education: $173,000
Other - Elementary and Secondary Education: $149,000
- Local Intergovernmental - Public Welfare: $2,969,000
Public Welfare: $2,754,000
Health and Hospitals: $1,365,000
Education: $696,000
Education: $593,000
Other: $502,000
Other: $187,000
General Local Government Support: $56,000
General Local Government Support: $53,000
- Long Term Debt - Beginning Outstanding - Unspecified Public Purpose: $159,991,000
Beginning Outstanding - Unspecified Public Purpose: $145,064,000
Outstanding Unspecified Public Purpose: $140,165,000
Outstanding Unspecified Public Purpose: $139,596,000
Retired Unspecified Public Purpose: $19,826,000
Retired Unspecified Public Purpose: $5,468,000
- Miscellaneous - Interest Earnings: $467,000
Rents: $363,000
Rents: $350,000
General Revenue - Other: $340,000
General Revenue - Other: $232,000
Fines and Forfeits: $104,000
Fines and Forfeits: $91,000
Interest Earnings: $26,000
Donations From Private Sources: $22,000
Sale of Property: $7,000
Sale of Property: $5,000
Donations From Private Sources: $2,000
- Other Capital Outlay - Elementary and Secondary Education: $23,114,000
Correctional Institutions: $4,404,000
Correctional Institutions: $3,469,000
Elementary and Secondary Education: $1,632,000
Health - Other: $74,000
- Other Funds - Cash and Securities: $34,573,000
Cash and Securities: $31,582,000
- Sinking Funds - Cash and Securities: $221,000
- State Intergovernmental - Education: $34,385,000
Education: $32,229,000
Health and Hospitals: $8,461,000
General Local Government Support: $4,581,000
General Local Government Support: $4,541,000
- Tax - Property: $51,499,000
Property: $45,971,000
General Sales and Gross Receipts: $4,548,000
General Sales and Gross Receipts: $4,056,000
Motor Vehicle License: $926,000
Motor Vehicle License: $871,000
Occupation and Business License - Other: $859,000
Occupation and Business License - Other: $837,000
Public Utilities Sales: $764,000
Public Utilities Sales: $761,000
Other License: $350,000
Other License: $307,000
- Total Salaries and Wages: $34,765,000
: $32,242,000
Warren County government finances - Cash and Securities in 2020:
- Assistance and Subsidies - Public Welfare, Federal Categorical Assistance Programs: $5,707,000
- Charges - Other: $9,621,000
Elementary and Secondary Education School Lunch: $1,357,000
Elementary and Secondary Education School Lunch: $1,184,000
Solid Waste Management: $1,093,000
Solid Waste Management: $1,067,000
Parks and Recreation: $298,000
Parks and Recreation: $262,000
Air Transportation: $176,000
Air Transportation: $172,000
Sewerage: $82,000
Sewerage: $78,000
Elementary and Secondary Education - Other: $41,000
Elementary and Secondary Education - Other: $27,000
Sea and Inland Port Facilities: $20,000
Sea and Inland Port Facilities: $20,000
Elementary and Secondary Education School Tuition and Transportation: $15,000
Elementary and Secondary Education School Tuition and Transportation: $11,000
Miscellaneous Commercial Activities: $3,000
Natural Resources - Other: $2,000
- Construction - Elementary and Secondary Education: $3,580,000
Elementary and Secondary Education: $1,107,000
Air Transportation: $501,000
Air Transportation: $194,000
Libraries: $53,000
Libraries: $53,000
- Current Operations - Elementary and Secondary Education: $61,472,000
Elementary and Secondary Education: $54,468,000
Health - Other: $20,304,000
Police Protection: $6,107,000
Public Welfare - Other: $5,650,000
Police Protection: $5,372,000
Local Fire Protection: $4,722,000
Local Fire Protection: $4,247,000
Solid Waste Management: $3,389,000
Solid Waste Management: $2,940,000
Parks and Recreation: $2,823,000
Judicial and Legal Services: $2,797,000
Judicial and Legal Services: $2,490,000
Parks and Recreation: $2,483,000
Central Staff Services: $2,147,000
Financial Administration: $1,554,000
Financial Administration: $1,488,000
Central Staff Services: $1,417,000
General Public Buildings: $1,276,000
General - Other: $1,272,000
General - Other: $1,138,000
Libraries: $1,022,000
Libraries: $945,000
General Public Buildings: $941,000
Protective Inspection and Regulation - Other: $679,000
Protective Inspection and Regulation - Other: $564,000
Public Welfare - Other: $456,000
Health - Other: $344,000
Air Transportation: $187,000
Air Transportation: $102,000
Corrections - Other: $66,000
Corrections - Other: $62,000
Regular Highways: $18,000
Regular Highways: $9,000
- Federal Intergovernmental - Health and Hospitals: $352,000
Education: $4,000
- General - Interest on Debt: $5,803,000
Interest on Debt: $5,436,000
- Intergovernmental to Local - Other - Elementary and Secondary Education: $173,000
Other - Elementary and Secondary Education: $149,000
- Local Intergovernmental - Public Welfare: $2,969,000
Public Welfare: $2,754,000
Health and Hospitals: $1,365,000
Education: $696,000
Education: $593,000
Other: $502,000
Other: $187,000
General Local Government Support: $56,000
General Local Government Support: $53,000
- Long Term Debt - Beginning Outstanding - Unspecified Public Purpose: $159,991,000
Beginning Outstanding - Unspecified Public Purpose: $145,064,000
Outstanding Unspecified Public Purpose: $140,165,000
Outstanding Unspecified Public Purpose: $139,596,000
Retired Unspecified Public Purpose: $19,826,000
Retired Unspecified Public Purpose: $5,468,000
- Miscellaneous - Interest Earnings: $467,000
Rents: $363,000
Rents: $350,000
General Revenue - Other: $340,000
General Revenue - Other: $232,000
Fines and Forfeits: $104,000
Fines and Forfeits: $91,000
Interest Earnings: $26,000
Donations From Private Sources: $22,000
Sale of Property: $7,000
Sale of Property: $5,000
Donations From Private Sources: $2,000
- Other Capital Outlay - Elementary and Secondary Education: $23,114,000
Correctional Institutions: $4,404,000
Correctional Institutions: $3,469,000
Elementary and Secondary Education: $1,632,000
Health - Other: $74,000
- Other Funds - Cash and Securities: $34,573,000
Cash and Securities: $31,582,000
- Sinking Funds - Cash and Securities: $221,000
- State Intergovernmental - Education: $34,385,000
Education: $32,229,000
Health and Hospitals: $8,461,000
General Local Government Support: $4,581,000
General Local Government Support: $4,541,000
- Tax - Property: $51,499,000
Property: $45,971,000
General Sales and Gross Receipts: $4,548,000
General Sales and Gross Receipts: $4,056,000
Motor Vehicle License: $926,000
Motor Vehicle License: $871,000
Occupation and Business License - Other: $859,000
Occupation and Business License - Other: $837,000
Public Utilities Sales: $764,000
Public Utilities Sales: $761,000
Other License: $350,000
Other License: $307,000
- Total Salaries and Wages: $34,765,000
: $32,242,000
Supplemental Security Income (SSI) in 2006:
- Total number of recipients: 464
- Number of aged recipients: 54
- Number of blind and disabled recipients: 410
- Number of recipients under 18: 67
- Number of recipients between 18 and 64: 284
- Number of recipients older than 64: 113
- Number of recipients also receiving OASDI: 181
- Amount of payments (thousands of dollars): 191
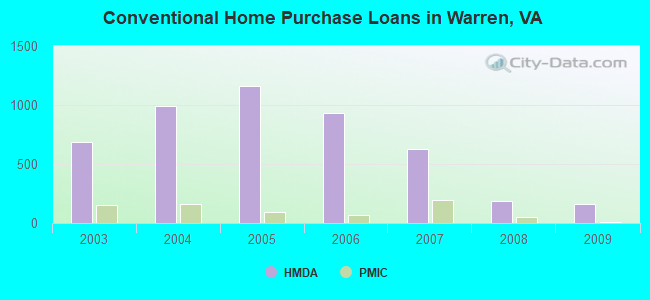
| Home Mortgage Disclosure Act Aggregated Statistics For Year 2009 (Based on 7 full tracts) | ||||||||||||||
| A) FHA, FSA/RHS & VA Home Purchase Loans | B) Conventional Home Purchase Loans | C) Refinancings | D) Home Improvement Loans | E) Loans on Dwellings For 5+ Families | F) Non-occupant Loans on < 5 Family Dwellings (A B C & D) | G) Loans On Manufactured Home Dwelling (A B C & D) | ||||||||
|---|---|---|---|---|---|---|---|---|---|---|---|---|---|---|
| Number | Average Value | Number | Average Value | Number | Average Value | Number | Average Value | Number | Average Value | Number | Average Value | Number | Average Value | |
| LOANS ORIGINATED | 248 | $164,673 | 157 | $172,025 | 807 | $203,473 | 57 | $67,684 | 4 | $163,000 | 117 | $168,060 | 6 | $82,667 |
| APPLICATIONS APPROVED, NOT ACCEPTED | 10 | $174,000 | 11 | $148,273 | 62 | $211,484 | 9 | $34,556 | 0 | $0 | 9 | $101,222 | 0 | $0 |
| APPLICATIONS DENIED | 48 | $153,167 | 40 | $165,675 | 491 | $212,603 | 44 | $63,636 | 0 | $0 | 35 | $163,600 | 6 | $78,500 |
| APPLICATIONS WITHDRAWN | 21 | $133,524 | 35 | $207,943 | 259 | $220,938 | 8 | $44,375 | 0 | $0 | 15 | $180,133 | 0 | $0 |
| FILES CLOSED FOR INCOMPLETENESS | 13 | $174,000 | 5 | $275,800 | 68 | $218,853 | 2 | $80,000 | 0 | $0 | 5 | $266,800 | 0 | $0 |
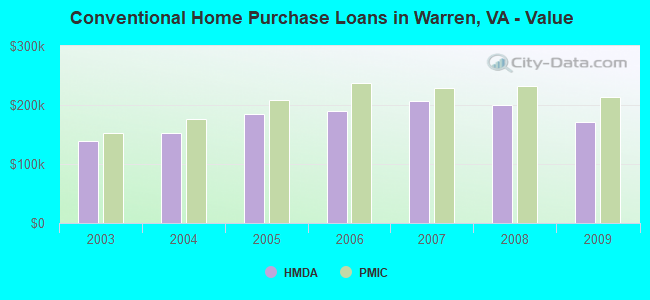
| Private Mortgage Insurance Companies Aggregated Statistics For Year 2009 (Based on 7 full tracts) | ||||||
| A) Conventional Home Purchase Loans | B) Refinancings | C) Non-occupant Loans on < 5 Family Dwellings (A & B) | ||||
|---|---|---|---|---|---|---|
| Number | Average Value | Number | Average Value | Number | Average Value | |
| LOANS ORIGINATED | 8 | $213,625 | 12 | $249,417 | 2 | $324,500 |
| APPLICATIONS APPROVED, NOT ACCEPTED | 7 | $182,143 | 8 | $217,250 | 2 | $126,000 |
| APPLICATIONS DENIED | 2 | $180,000 | 5 | $295,600 | 0 | $0 |
| APPLICATIONS WITHDRAWN | 1 | $280,000 | 3 | $250,333 | 1 | $235,000 |
| FILES CLOSED FOR INCOMPLETENESS | 0 | $0 | 0 | $0 | 0 | $0 |
| Most common first names in Warren County, VA among deceased individuals | ||
| Name | Count | Lived (average) |
|---|---|---|
| James | 230 | 72.2 years |
| William | 212 | 72.7 years |
| Mary | 194 | 78.5 years |
| John | 160 | 72.4 years |
| Charles | 149 | 71.4 years |
| Robert | 148 | 70.6 years |
| Dorothy | 77 | 77.8 years |
| Thomas | 76 | 70.2 years |
| George | 71 | 71.5 years |
| Virginia | 69 | 80.3 years |
| Most common last names in Warren County, VA among deceased individuals | ||
| Last name | Count | Lived (average) |
|---|---|---|
| Williams | 109 | 70.1 years |
| Henry | 92 | 73.5 years |
| Smith | 77 | 72.6 years |
| Robinson | 60 | 72.8 years |
| Jenkins | 51 | 71.8 years |
| Ramey | 46 | 73.7 years |
| Jones | 45 | 70.8 years |
| Cameron | 41 | 70.4 years |
| Thompson | 40 | 69.5 years |
| Johnson | 40 | 76.3 years |
| Businesses in Warren County, VA | ||||
| Name | Count | Name | Count | |
|---|---|---|---|---|
| 7-Eleven | 8 | Lane Furniture | 1 | |
| AT&T | 3 | Lowe's | 1 | |
| Advance Auto Parts | 1 | Martin's | 1 | |
| Applebee's | 1 | McDonald's | 2 | |
| Arby's | 1 | Nike | 3 | |
| AutoZone | 1 | Panda Express | 1 | |
| Baskin-Robbins | 1 | Papa John's Pizza | 1 | |
| Bath & Body Works | 1 | Penske | 1 | |
| Burger King | 1 | Pizza Hut | 1 | |
| CVS | 1 | Quality | 1 | |
| Chevrolet | 1 | RadioShack | 1 | |
| Cracker Barrel | 1 | Rite Aid | 1 | |
| Dunkin Donuts | 2 | Sprint Nextel | 1 | |
| Famous Footwear | 1 | Staples | 1 | |
| Fashion Bug | 1 | Starbucks | 2 | |
| FedEx | 3 | Subway | 2 | |
| Ford | 1 | Super 8 | 2 | |
| GNC | 2 | T-Mobile | 1 | |
| GameStop | 1 | T.G.I. Driday's | 1 | |
| H&R Block | 1 | Taco Bell | 1 | |
| Hilton | 1 | Target | 1 | |
| Holiday Inn | 1 | True Value | 1 | |
| Houlihan's | 1 | U-Haul | 1 | |
| KFC | 1 | UPS | 6 | |
| Kmart | 1 | Walmart | 1 | |
| La-Z-Boy | 2 | Wendy's | 1 | |
Warren County on our top lists:
- #27 on the list of "Top 101 counties with the lowest Particulate Matter (PM10) Annual air pollution readings in 2012 (µg/m3)"