Crime rate in Arlington, Texas (TX): murders, rapes, robberies, assaults, burglaries, thefts, auto thefts, arson, law enforcement employees, police officers, crime map
Crime rate in Arlington, TX
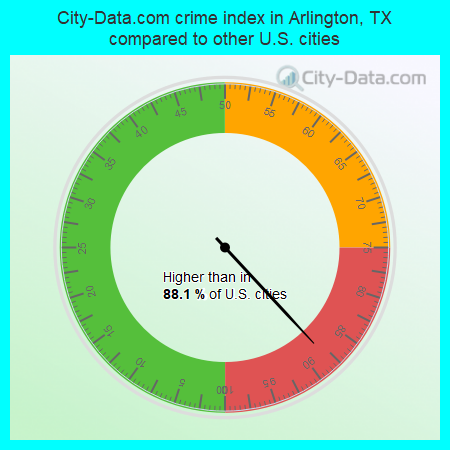
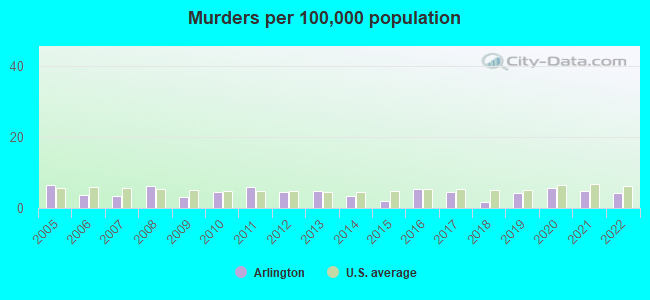
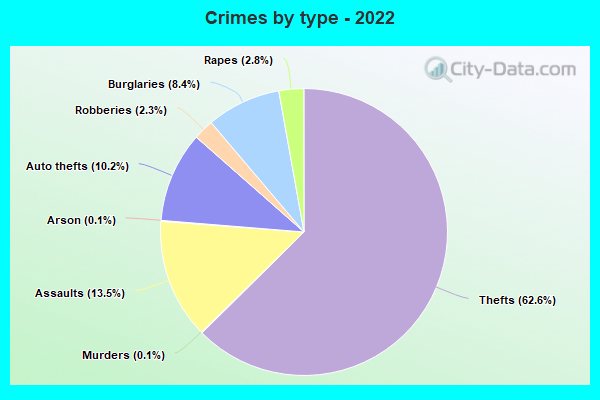
The 2022 crime rate in Arlington, TX is 303 (City-Data.com crime index), which is 1.2 times greater than the U.S. average. It was higher than in 88.1% U.S. cities. The 2022 Arlington crime rate fell by 3% compared to 2021. The number of homicides stood at 16 - a decrease of 3 compared to 2021. In the last 5 years Arlington has seen rise of violent crime and decline of property crime.See how dangerous Arlington, TX is compared to the nearest cities:
(Note: Higher means more crime)
(Note: Higher means more crime)
| Arlington: | 303.4 |
| Pantego: | 219.1 |
| Dalworthington Gardens: | 98.7 |
| Grand Prairie: | 153.8 |
| Kennedale: | 208.3 |
| Mansfield: | 95.2 |
| Forest Hill: | 284.8 |
| Richland Hills: | 223.4 |
| Hurst: | 203.2 |
The City-Data.com crime index weighs serious crimes and violent crimes more heavily. Higher means more crime, U.S. average is 246.1. It adjusts for the number of visitors and daily workers commuting into cities.
- means the value is smaller than the state average.- means the value is about the same as the state average.
- means the value is bigger than the state average.
- means the value is much bigger than the state average.
According to our research of Texas and other state lists, there were 595 registered sex offenders living in Arlington, Texas as of May 17, 2024.
The ratio of all residents to sex offenders in Arlington is 660 to 1.
The ratio of registered sex offenders to all residents in this city is lower than the state average.
Violent crime rate in 2022
| Arlington: | 339.1 |
| U.S. Average: | 219.8 |
Violent crime rate in 2021
| Arlington: | 341.6 |
| U.S. Average: | 224.8 |
Violent crime rate in 2020
| Arlington: | 319.5 |
| U.S. Average: | 228.2 |
Violent crime rate in 2019
| Arlington: | 305.0 |
| U.S. Average: | 219.9 |
Violent crime rate in 2018
| Arlington: | 270.1 |
| U.S. Average: | 221.2 |
Violent crime rate in 2017
| Arlington: | 305.0 |
| U.S. Average: | 226.2 |
Violent crime rate in 2016
| Arlington: | 325.7 |
| U.S. Average: | 227.3 |
Violent crime rate in 2015
| Arlington: | 281.0 |
| U.S. Average: | 219.3 |
Violent crime rate in 2014
| Arlington: | 274.0 |
| U.S. Average: | 211.1 |
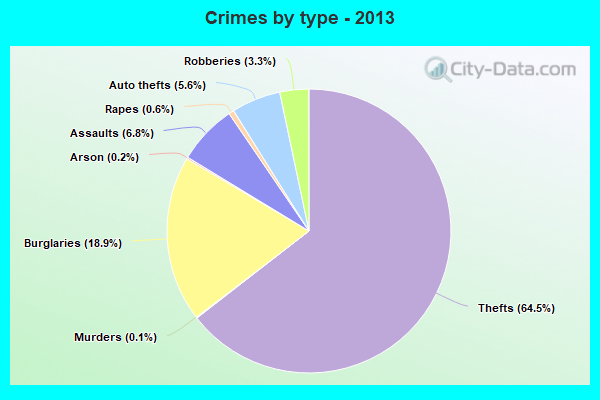
Violent crime rate in 2013
| Arlington: | 263.5 |
| U.S. Average: | 214.2 |
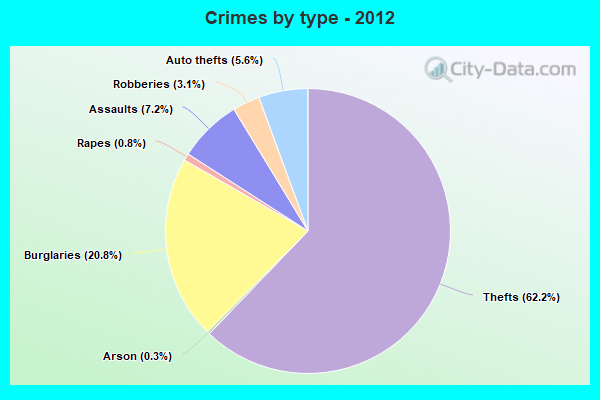
Violent crime rate in 2012
| Arlington: | 276.2 |
| U.S. Average: | 187.4 |
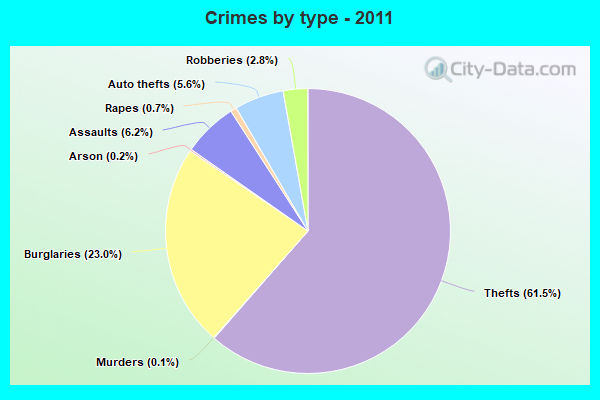
Violent crime rate in 2011
| Arlington: | 278.2 |
| U.S. Average: | 187.1 |
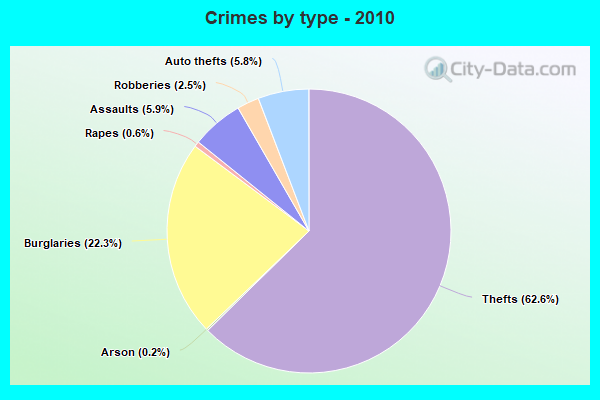
Violent crime rate in 2010
| Arlington: | 286.2 |
| U.S. Average: | 195.7 |
Violent crime rate in 2009
| Arlington: | 332.1 |
| U.S. Average: | 208.9 |
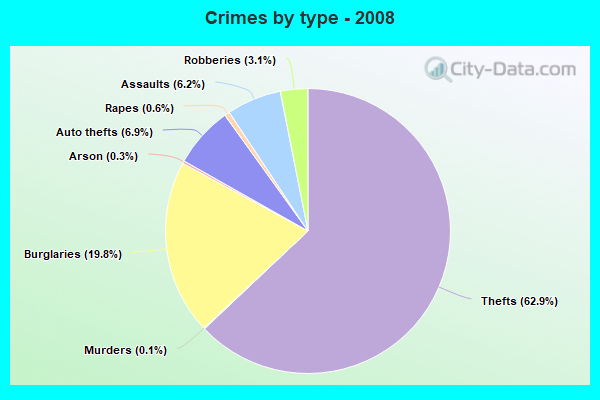
Violent crime rate in 2008
| Arlington: | 328.9 |
| U.S. Average: | 222.5 |
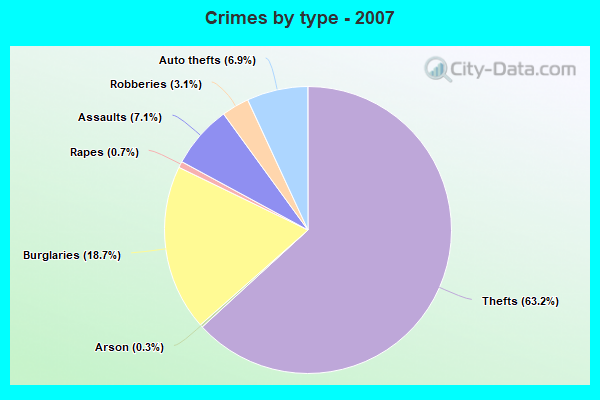
Violent crime rate in 2007
| Arlington: | 341.0 |
| U.S. Average: | 229.1 |
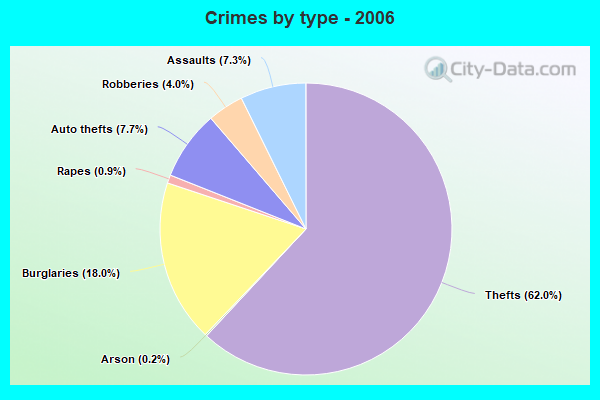
Violent crime rate in 2006
| Arlington: | 361.9 |
| U.S. Average: | 232.6 |
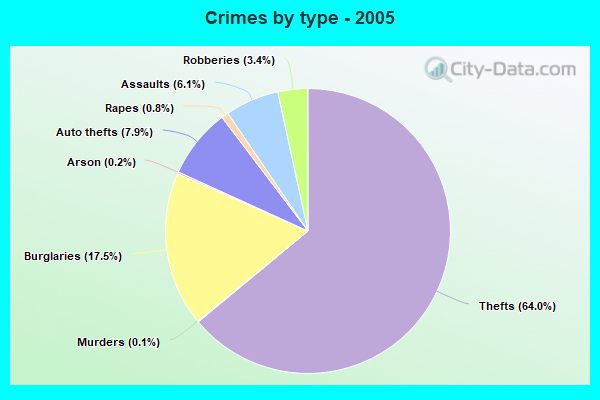
Violent crime rate in 2005
| Arlington: | 326.8 |
| U.S. Average: | 227.0 |
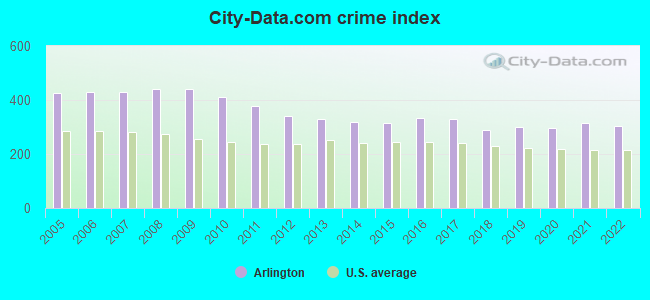
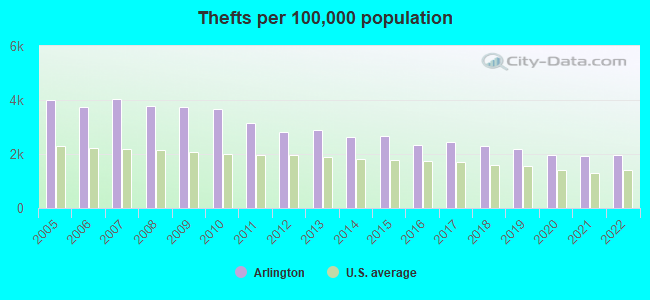
Property crime rate in 2022
| Arlington: | 197.0 |
| U.S. Average: | 166.5 |
Property crime rate in 2021
| Arlington: | 208.7 |
| U.S. Average: | 157.8 |
Property crime rate in 2020
| Arlington: | 205.2 |
| U.S. Average: | 169.6 |
Property crime rate in 2019
| Arlington: | 220.4 |
| U.S. Average: | 179.7 |
Property crime rate in 2018
| Arlington: | 236.7 |
| U.S. Average: | 190.2 |
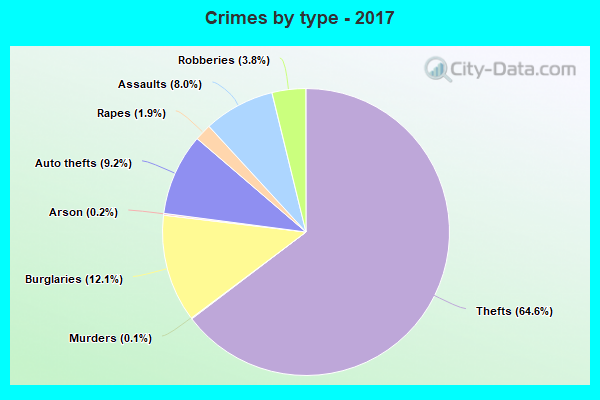
Property crime rate in 2017
| Arlington: | 264.1 |
| U.S. Average: | 206.4 |
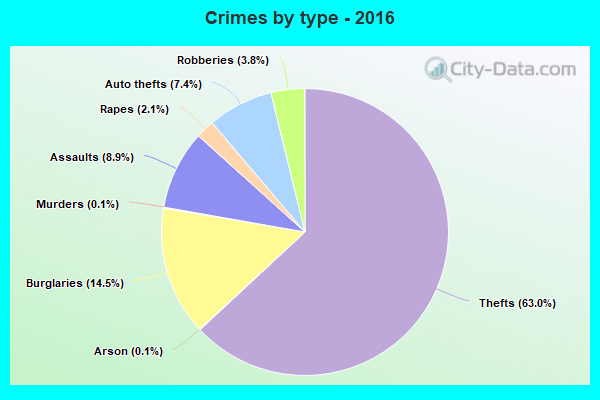
Property crime rate in 2016
| Arlington: | 266.0 |
| U.S. Average: | 216.6 |
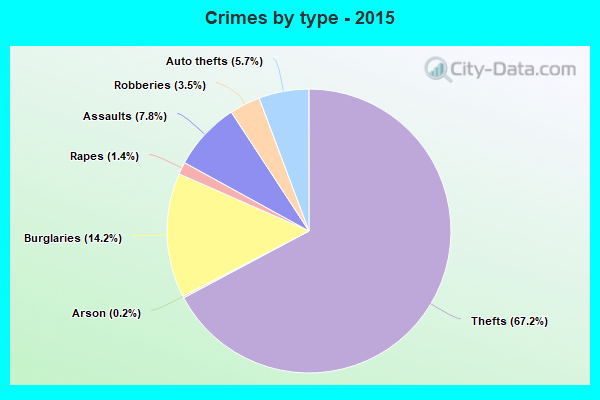
Property crime rate in 2015
| Arlington: | 278.8 |
| U.S. Average: | 221.5 |
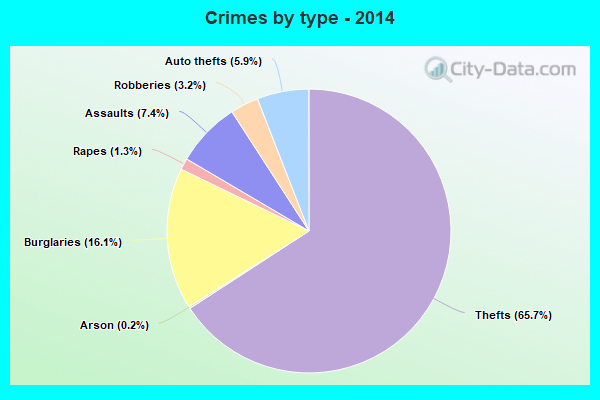
Property crime rate in 2014
| Arlington: | 296.2 |
| U.S. Average: | 230.8 |
Property crime rate in 2013
| Arlington: | 348.8 |
| U.S. Average: | 250.4 |
Property crime rate in 2012
| Arlington: | 364.3 |
| U.S. Average: | 267.3 |
Property crime rate in 2011
| Arlington: | 435.5 |
| U.S. Average: | 273.5 |
Property crime rate in 2010
| Arlington: | 494.3 |
| U.S. Average: | 276.4 |
Property crime rate in 2009
| Arlington: | 502.1 |
| U.S. Average: | 285.6 |
Property crime rate in 2008
| Arlington: | 487.3 |
| U.S. Average: | 302.2 |
Property crime rate in 2007
| Arlington: | 462.0 |
| U.S. Average: | 309.2 |
Property crime rate in 2006
| Arlington: | 430.5 |
| U.S. Average: | 317.3 |
Property crime rate in 2005
| Arlington: | 448.9 |
| U.S. Average: | 322.3 |
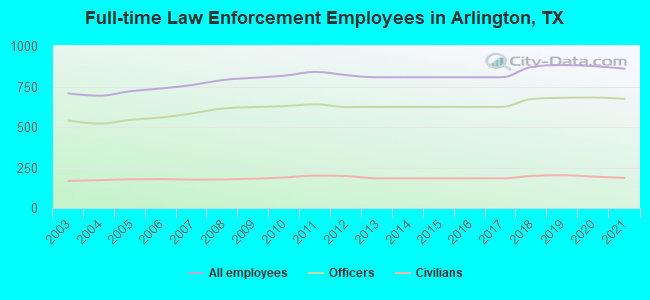
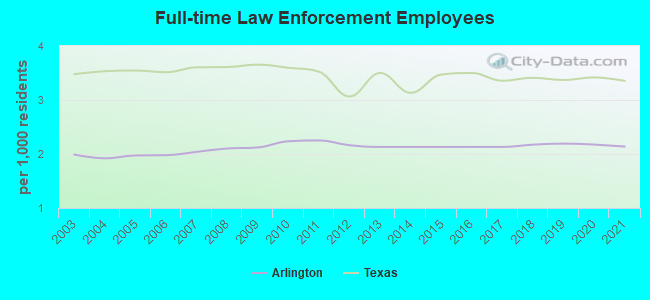
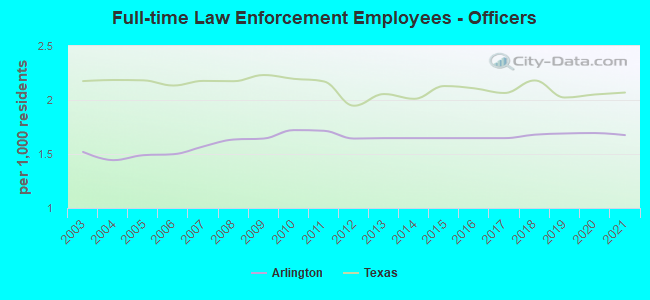
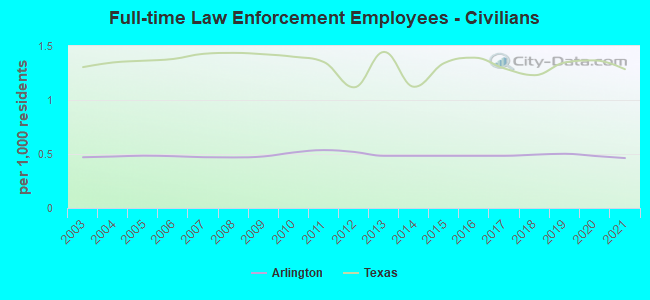
Full-time law enforcement employees in 2021, including police officers: 860 (674 officers - 545 male; 129 female).
| Officers per 1,000 residents here: | 1.68 |
| Texas average: | 2.07 |
Full-time law enforcement employees in 2020, including police officers: 876 (682 officers - 546 male; 136 female).
| Officers per 1,000 residents here: | 1.69 |
| Texas average: | 2.05 |
Full-time law enforcement employees in 2019, including police officers: 882 (680 officers - 546 male; 134 female).
| Officers per 1,000 residents here: | 1.69 |
| Texas average: | 2.02 |
Full-time law enforcement employees in 2018, including police officers: 871 (673 officers - 536 male; 137 female).
| Officers per 1,000 residents here: | 1.68 |
| Texas average: | 2.18 |
Full-time law enforcement employees in 2013, including police officers: 807 (624 officers - 501 male; 123 female).
| Officers per 1,000 residents here: | 1.65 |
| Texas average: | 2.05 |
Full-time law enforcement employees in 2012, including police officers: 820 (623 officers - 503 male; 120 female).
| Officers per 1,000 residents here: | 1.64 |
| Texas average: | 1.95 |
Full-time law enforcement employees in 2011, including police officers: 840 (640 officers - 521 male; 119 female).
| Officers per 1,000 residents here: | 1.72 |
| Texas average: | 2.17 |
Full-time law enforcement employees in 2010, including police officers: 817 (629 officers - 514 male; 115 female).
| Officers per 1,000 residents here: | 1.72 |
| Texas average: | 2.20 |
Full-time law enforcement employees in 2009, including police officers: 804 (623 officers - 508 male; 115 female).
| Officers per 1,000 residents here: | 1.64 |
| Texas average: | 2.23 |
Full-time law enforcement employees in 2008, including police officers: 790 (614 officers - 499 male; 115 female).
| Officers per 1,000 residents here: | 1.63 |
| Texas average: | 2.17 |
Full-time law enforcement employees in 2007, including police officers: 759 (584 officers - 482 male; 102 female).
| Officers per 1,000 residents here: | 1.57 |
| Texas average: | 2.18 |
Full-time law enforcement employees in 2006, including police officers: 738 (559 officers - 459 male; 100 female).
| Officers per 1,000 residents here: | 1.50 |
| Texas average: | 2.13 |
Full-time law enforcement employees in 2005, including police officers: 721 (544 officers - 454 male; 90 female).
| Officers per 1,000 residents here: | 1.49 |
| Texas average: | 2.18 |
Full-time law enforcement employees in 2004, including police officers: 693 (521 officers - 436 male; 85 female).
| Officers per 1,000 residents here: | 1.44 |
| Texas average: | 2.19 |
Full-time law enforcement employees in 2003, including police officers: 707 (540 officers - 455 male; 85 female).
| Officers per 1,000 residents here: | 1.52 |
| Texas average: | 2.17 |

Zip codes: 75050, 75051, 75052, 76001, 76002, 76006, 76010, 76011, 76012, 76013, 76014, 76015, 76016, 76017, 76018, 76040, 76060, 76063, 76112, 76119, 76120.