Crime rate in Grand Prairie, Texas (TX): murders, rapes, robberies, assaults, burglaries, thefts, auto thefts, arson, law enforcement employees, police officers, crime map
Crime rate in Grand Prairie, TX
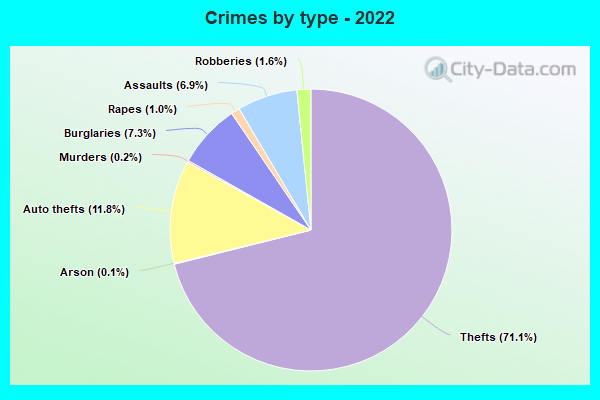
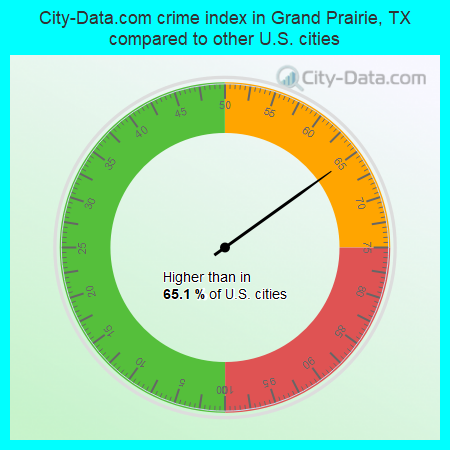
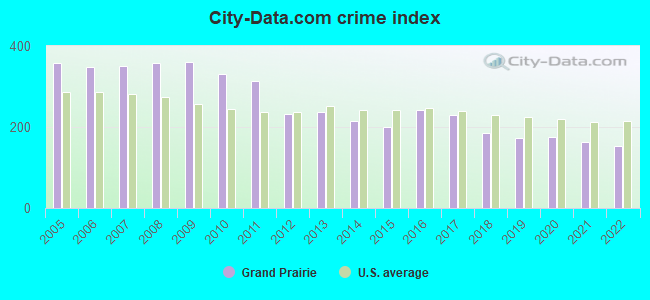
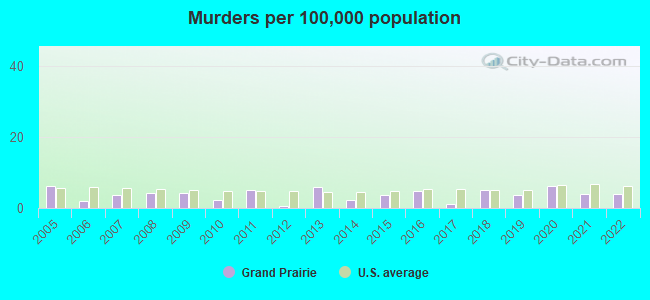
The 2022 crime rate in Grand Prairie, TX is 154 (City-Data.com crime index), which is 1.6 times lower than the U.S. average. It was higher than in 65.1% U.S. cities. The 2022 Grand Prairie crime rate fell by 7% compared to 2021. The number of homicides stood at 8. In the last 5 years Grand Prairie has seen decreasing violent crime and decline of property crime.See how dangerous Grand Prairie, TX is compared to the nearest cities:
(Note: Higher means more crime)
(Note: Higher means more crime)
| Grand Prairie: | 153.8 |
| Arlington: | 303.4 |
| Cockrell Hill: | 175.8 |
| Duncanville: | 241.9 |
| Pantego: | 219.1 |
| Dalworthington Gardens: | 98.7 |
| Irving: | 241.7 |
| Cedar Hill: | 151.9 |
| Euless: | 207.7 |
The City-Data.com crime index weighs serious crimes and violent crimes more heavily. Higher means more crime, U.S. average is 246.1. It adjusts for the number of visitors and daily workers commuting into cities.
- means the value is smaller than the state average.- means the value is about the same as the state average.
- means the value is bigger than the state average.
- means the value is much bigger than the state average.
According to our research of Texas and other state lists, there were 259 registered sex offenders living in Grand Prairie, Texas as of May 17, 2024.
The ratio of all residents to sex offenders in Grand Prairie is 736 to 1.
The ratio of registered sex offenders to all residents in this city is lower than the state average.
Violent crime rate in 2022
| Grand Prairie: | 117.9 |
| U.S. Average: | 219.8 |
Violent crime rate in 2021
| Grand Prairie: | 140.1 |
| U.S. Average: | 224.8 |
Violent crime rate in 2020
| Grand Prairie: | 145.2 |
| U.S. Average: | 228.2 |
Violent crime rate in 2019
| Grand Prairie: | 126.4 |
| U.S. Average: | 219.9 |
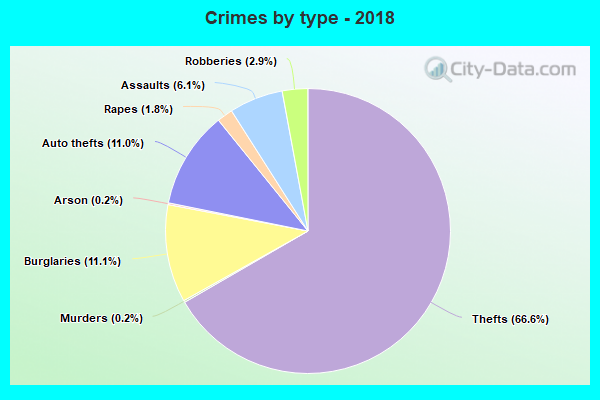
Violent crime rate in 2018
| Grand Prairie: | 150.1 |
| U.S. Average: | 221.2 |
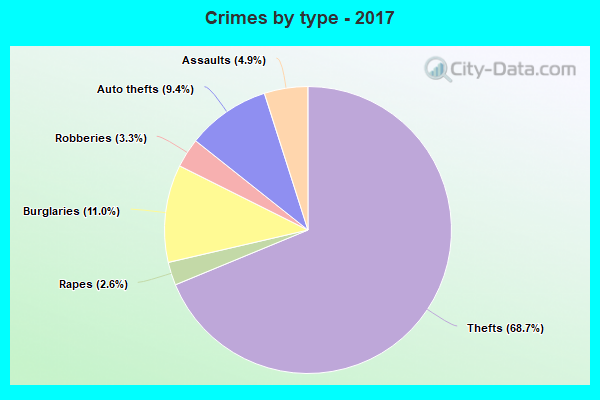
Violent crime rate in 2017
| Grand Prairie: | 185.0 |
| U.S. Average: | 226.2 |
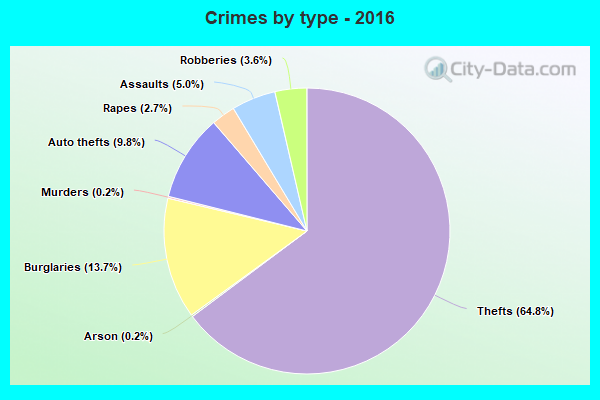
Violent crime rate in 2016
| Grand Prairie: | 197.9 |
| U.S. Average: | 227.3 |
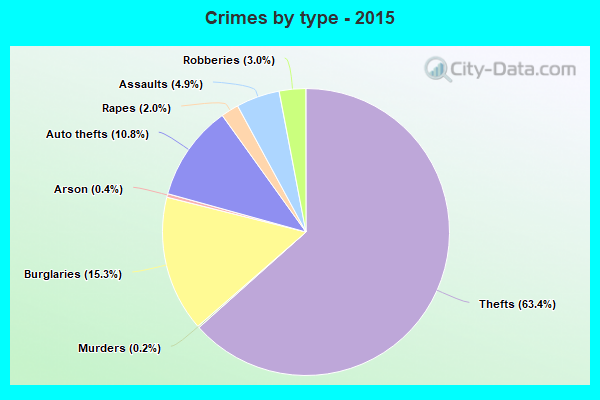
Violent crime rate in 2015
| Grand Prairie: | 152.2 |
| U.S. Average: | 219.3 |
Violent crime rate in 2014
| Grand Prairie: | 153.3 |
| U.S. Average: | 211.1 |
Violent crime rate in 2013
| Grand Prairie: | 162.7 |
| U.S. Average: | 214.2 |
Violent crime rate in 2012
| Grand Prairie: | 151.8 |
| U.S. Average: | 187.4 |
Violent crime rate in 2011
| Grand Prairie: | 191.8 |
| U.S. Average: | 187.1 |
Violent crime rate in 2010
| Grand Prairie: | 193.0 |
| U.S. Average: | 195.7 |
Violent crime rate in 2009
| Grand Prairie: | 181.2 |
| U.S. Average: | 208.9 |
Violent crime rate in 2008
| Grand Prairie: | 189.0 |
| U.S. Average: | 222.5 |
Violent crime rate in 2007
| Grand Prairie: | 208.5 |
| U.S. Average: | 229.1 |
Violent crime rate in 2006
| Grand Prairie: | 180.0 |
| U.S. Average: | 232.6 |
Violent crime rate in 2005
| Grand Prairie: | 175.5 |
| U.S. Average: | 227.0 |
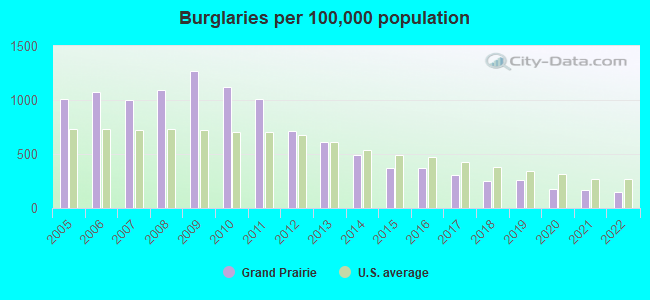
Property crime rate in 2022
| Grand Prairie: | 142.0 |
| U.S. Average: | 166.5 |
Property crime rate in 2021
| Grand Prairie: | 138.0 |
| U.S. Average: | 157.8 |
Property crime rate in 2020
| Grand Prairie: | 154.5 |
| U.S. Average: | 169.6 |
Property crime rate in 2019
| Grand Prairie: | 169.4 |
| U.S. Average: | 179.7 |
Property crime rate in 2018
| Grand Prairie: | 161.1 |
| U.S. Average: | 190.2 |
Property crime rate in 2017
| Grand Prairie: | 192.5 |
| U.S. Average: | 206.4 |
Property crime rate in 2016
| Grand Prairie: | 200.9 |
| U.S. Average: | 216.6 |
Property crime rate in 2015
| Grand Prairie: | 190.9 |
| U.S. Average: | 221.5 |
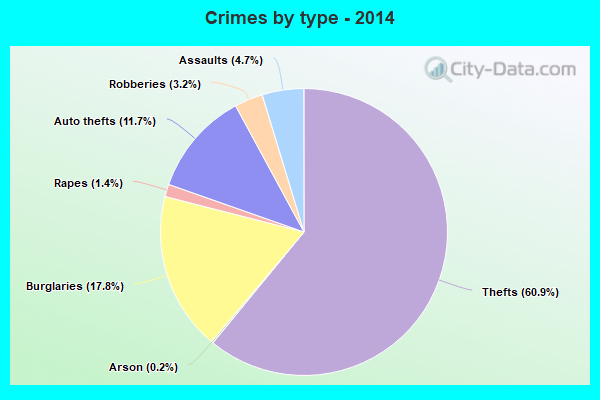
Property crime rate in 2014
| Grand Prairie: | 231.3 |
| U.S. Average: | 230.8 |
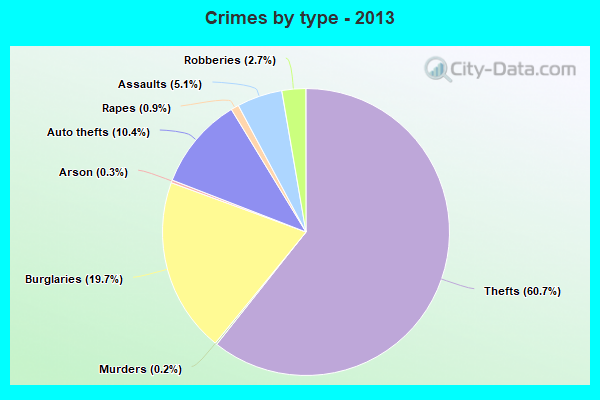
Property crime rate in 2013
| Grand Prairie: | 263.8 |
| U.S. Average: | 250.4 |
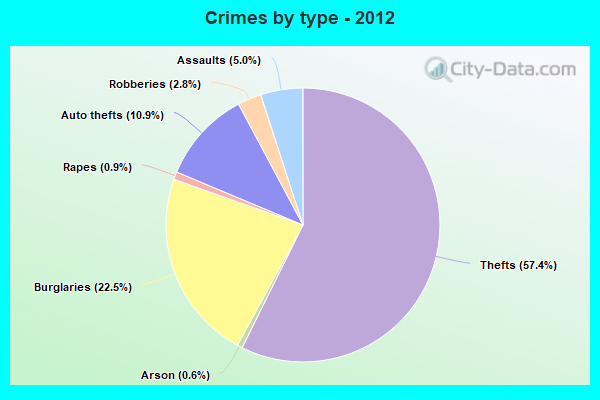
Property crime rate in 2012
| Grand Prairie: | 286.2 |
| U.S. Average: | 267.3 |
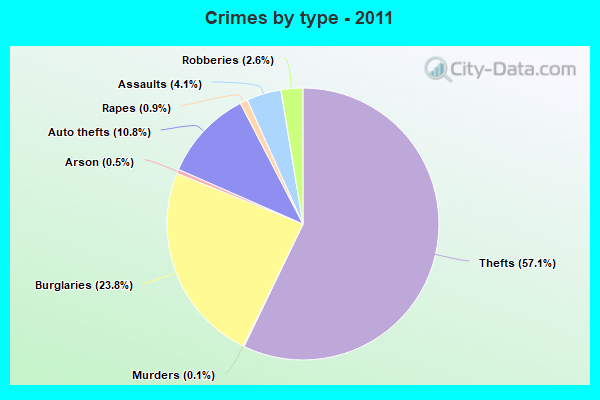
Property crime rate in 2011
| Grand Prairie: | 391.3 |
| U.S. Average: | 273.5 |
Property crime rate in 2010
| Grand Prairie: | 434.0 |
| U.S. Average: | 276.4 |
Property crime rate in 2009
| Grand Prairie: | 498.9 |
| U.S. Average: | 285.6 |
Property crime rate in 2008
| Grand Prairie: | 476.9 |
| U.S. Average: | 302.2 |
Property crime rate in 2007
| Grand Prairie: | 429.5 |
| U.S. Average: | 309.2 |
Property crime rate in 2006
| Grand Prairie: | 454.5 |
| U.S. Average: | 317.3 |
Property crime rate in 2005
| Grand Prairie: | 458.0 |
| U.S. Average: | 322.3 |
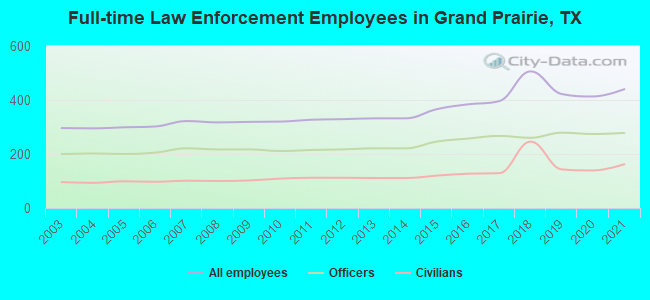
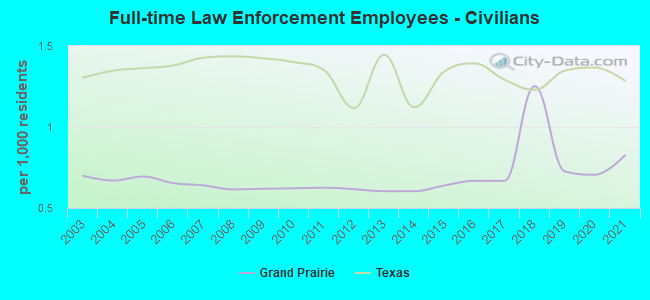
Full-time law enforcement employees in 2021, including police officers: 440 (278 officers - 252 male; 26 female).
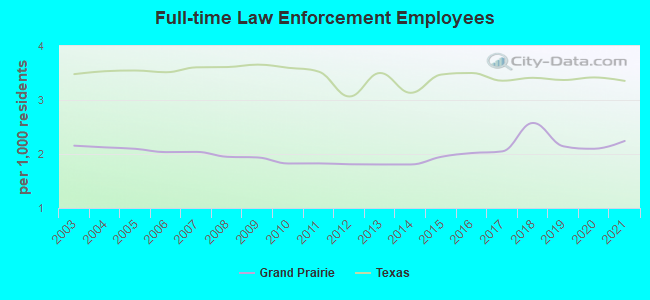
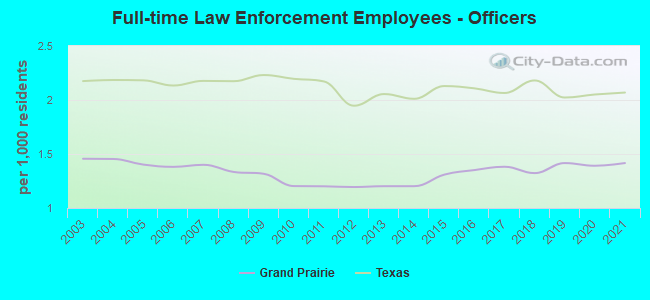
| Officers per 1,000 residents here: | 1.42 |
| Texas average: | 2.07 |
Full-time law enforcement employees in 2020, including police officers: 413 (274 officers - 249 male; 25 female).
| Officers per 1,000 residents here: | 1.39 |
| Texas average: | 2.05 |
Full-time law enforcement employees in 2019, including police officers: 422 (279 officers - 253 male; 26 female).
| Officers per 1,000 residents here: | 1.42 |
| Texas average: | 2.02 |
Full-time law enforcement employees in 2018, including police officers: 506 (260 officers - 238 male; 22 female).
| Officers per 1,000 residents here: | 1.32 |
| Texas average: | 2.18 |
Full-time law enforcement employees in 2017, including police officers: 396 (267 officers - 244 male; 23 female).
| Officers per 1,000 residents here: | 1.38 |
| Texas average: | 2.06 |
Full-time law enforcement employees in 2016, including police officers: 384 (257 officers - 236 male; 21 female).
| Officers per 1,000 residents here: | 1.35 |
| Texas average: | 2.11 |
Full-time law enforcement employees in 2015, including police officers: 366 (246 officers - 226 male; 20 female).
| Officers per 1,000 residents here: | 1.31 |
| Texas average: | 2.13 |
Full-time law enforcement employees in 2013, including police officers: 332 (221 officers - 207 male; 14 female).
| Officers per 1,000 residents here: | 1.20 |
| Texas average: | 2.05 |
Full-time law enforcement employees in 2012, including police officers: 329 (217 officers - 203 male; 14 female).
| Officers per 1,000 residents here: | 1.19 |
| Texas average: | 1.95 |
Full-time law enforcement employees in 2011, including police officers: 327 (215 officers - 203 male; 12 female).
| Officers per 1,000 residents here: | 1.20 |
| Texas average: | 2.17 |
Full-time law enforcement employees in 2010, including police officers: 320 (211 officers - 198 male; 13 female).
| Officers per 1,000 residents here: | 1.20 |
| Texas average: | 2.20 |
Full-time law enforcement employees in 2009, including police officers: 319 (217 officers - 201 male; 16 female).
| Officers per 1,000 residents here: | 1.32 |
| Texas average: | 2.23 |
Full-time law enforcement employees in 2008, including police officers: 317 (217 officers - 201 male; 16 female).
| Officers per 1,000 residents here: | 1.33 |
| Texas average: | 2.17 |
Full-time law enforcement employees in 2007, including police officers: 322 (221 officers - 204 male; 17 female).
| Officers per 1,000 residents here: | 1.40 |
| Texas average: | 2.18 |
Full-time law enforcement employees in 2006, including police officers: 302 (205 officers - 188 male; 17 female).
| Officers per 1,000 residents here: | 1.38 |
| Texas average: | 2.13 |
Full-time law enforcement employees in 2005, including police officers: 299 (200 officers - 181 male; 19 female).
| Officers per 1,000 residents here: | 1.40 |
| Texas average: | 2.18 |
Full-time law enforcement employees in 2004, including police officers: 295 (202 officers - 184 male; 18 female).
| Officers per 1,000 residents here: | 1.45 |
| Texas average: | 2.19 |
Full-time law enforcement employees in 2003, including police officers: 296 (200 officers - 187 male; 13 female).
| Officers per 1,000 residents here: | 1.46 |
| Texas average: | 2.17 |