Crime rate in Dayton, Ohio (OH): murders, rapes, robberies, assaults, burglaries, thefts, auto thefts, arson, law enforcement employees, police officers, crime map
Crime rate in Dayton, OH
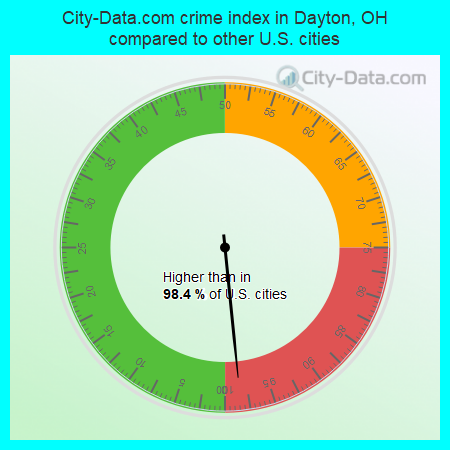
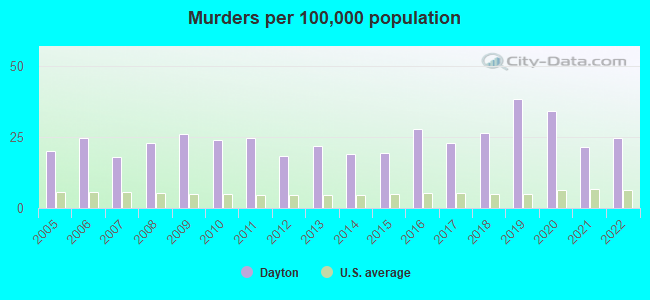
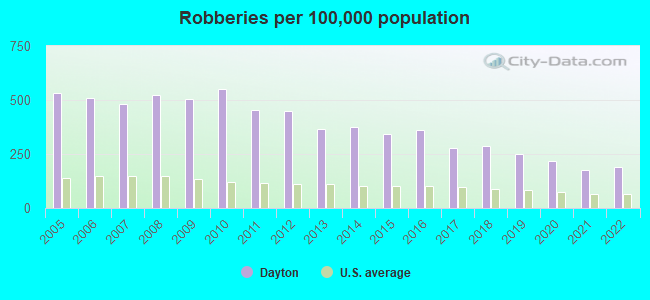
The 2022 crime rate in Dayton, OH is 629 (City-Data.com crime index), which is 2.6 times greater than the U.S. average. It was higher than in 98.4% U.S. cities. The 2022 Dayton crime rate rose by 20% compared to 2021. The number of homicides stood at 34 - an increase of 4 compared to 2021. In the last 5 years Dayton has seen increasing violent crime and rise of property crime.See how dangerous Dayton, OH is compared to the nearest cities:
(Note: Higher means more crime)
(Note: Higher means more crime)
| Dayton: | 629.3 |
| Oakwood: | 23.4 |
| Riverside: | 169.2 |
| Moraine: | 618.5 |
| Kettering: | 89.6 |
| Trotwood: | 414.6 |
| West Carrollton: | 175.1 |
| Huber Heights: | 162.1 |
| Beavercreek: | 110.9 |
The City-Data.com crime index weighs serious crimes and violent crimes more heavily. Higher means more crime, U.S. average is 246.1. It adjusts for the number of visitors and daily workers commuting into cities.
- means the value is bigger than the state average.- means the value is much bigger than the state average.
According to our research of Ohio and other state lists, there were 987 registered sex offenders living in Dayton, Ohio as of May 14, 2024.
The ratio of all residents to sex offenders in Dayton is 143 to 1.
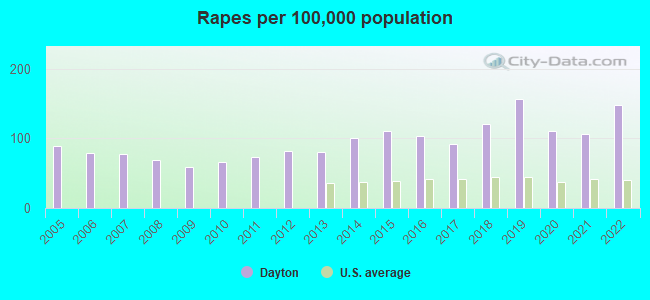
Violent crime rate in 2022
| Dayton: | 696.7 |
| U.S. Average: | 219.8 |
Violent crime rate in 2021
| Dayton: | 606.1 |
| U.S. Average: | 224.8 |
Violent crime rate in 2020
| Dayton: | 672.6 |
| U.S. Average: | 228.2 |
Violent crime rate in 2019
| Dayton: | 642.7 |
| U.S. Average: | 219.9 |
Violent crime rate in 2018
| Dayton: | 561.1 |
| U.S. Average: | 221.2 |
Violent crime rate in 2017
| Dayton: | 527.6 |
| U.S. Average: | 226.2 |
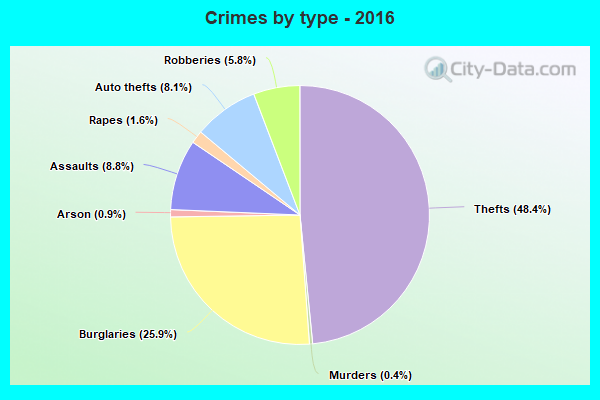
Violent crime rate in 2016
| Dayton: | 613.5 |
| U.S. Average: | 227.3 |
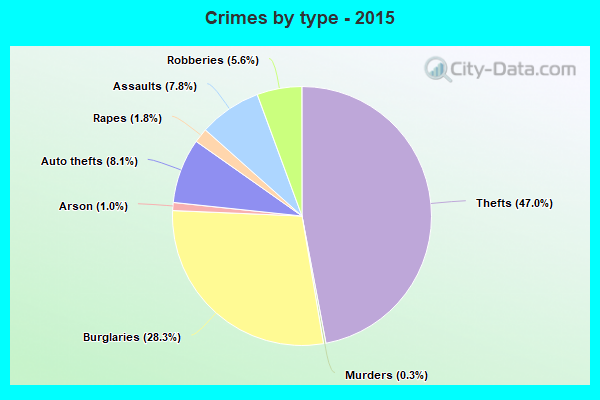
Violent crime rate in 2015
| Dayton: | 559.8 |
| U.S. Average: | 219.3 |
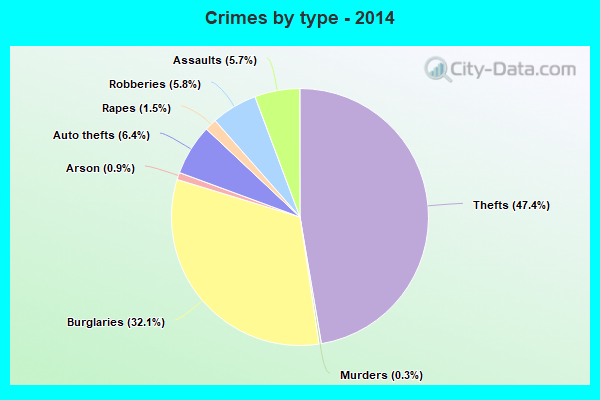
Violent crime rate in 2014
| Dayton: | 510.4 |
| U.S. Average: | 211.1 |
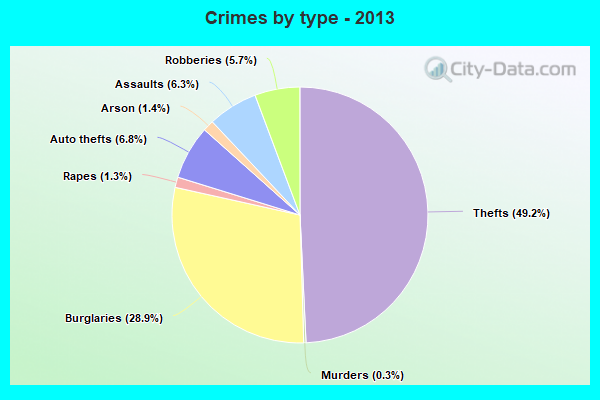
Violent crime rate in 2013
| Dayton: | 512.5 |
| U.S. Average: | 214.2 |
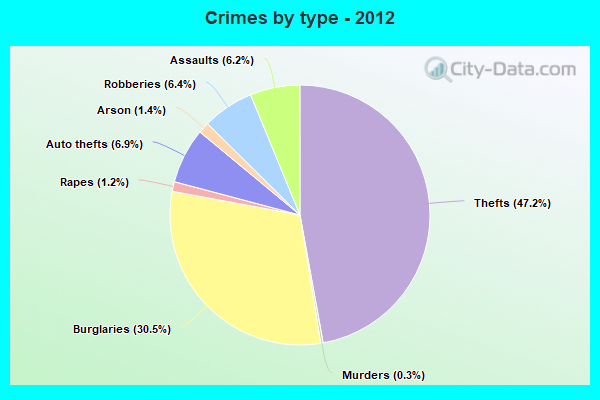
Violent crime rate in 2012
| Dayton: | 561.1 |
| U.S. Average: | 187.4 |
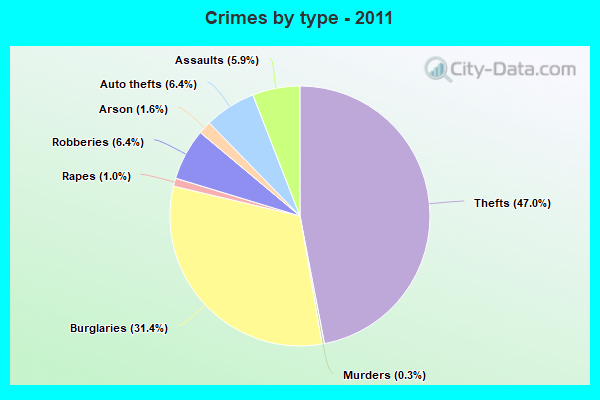
Violent crime rate in 2011
| Dayton: | 557.1 |
| U.S. Average: | 187.1 |
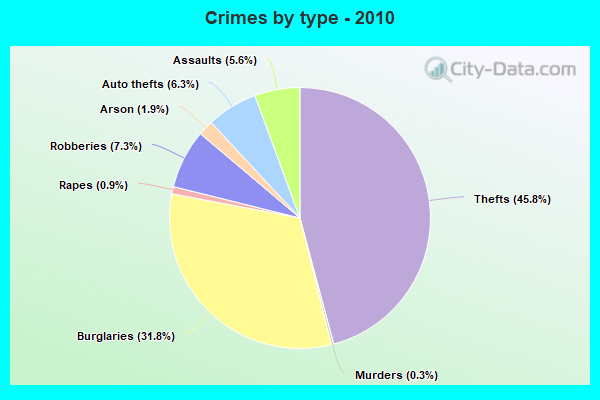
Violent crime rate in 2010
| Dayton: | 602.7 |
| U.S. Average: | 195.7 |
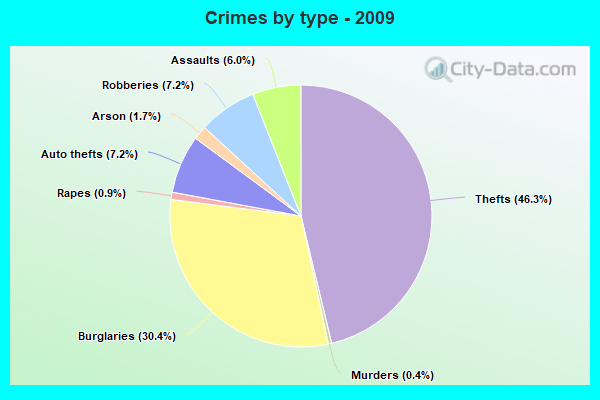
Violent crime rate in 2009
| Dayton: | 573.0 |
| U.S. Average: | 208.9 |
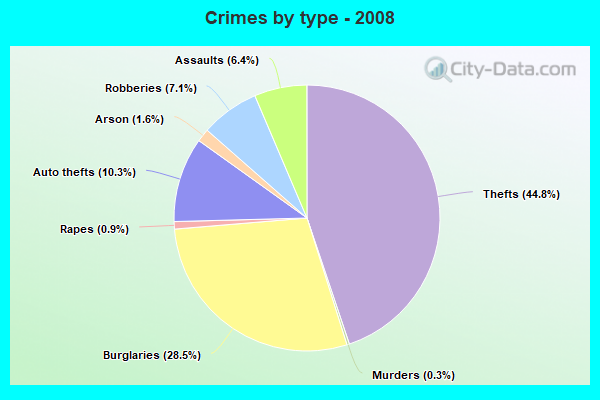
Violent crime rate in 2008
| Dayton: | 612.8 |
| U.S. Average: | 222.5 |
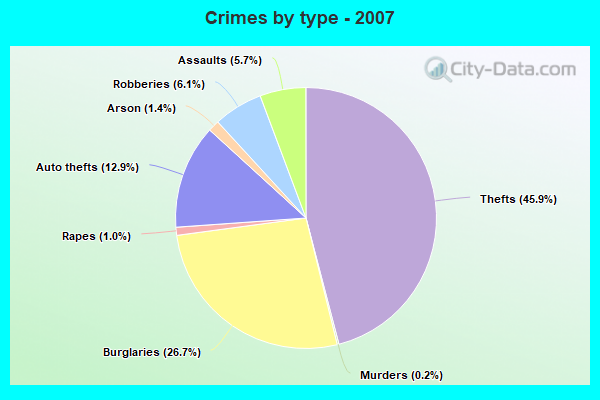
Violent crime rate in 2007
| Dayton: | 437.0 |
| U.S. Average: | 229.1 |
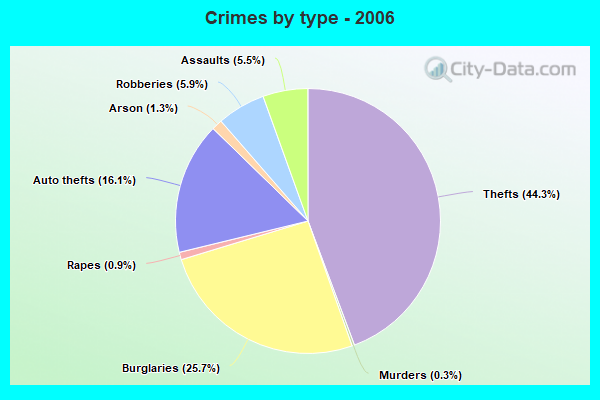
Violent crime rate in 2006
| Dayton: | 466.8 |
| U.S. Average: | 232.6 |
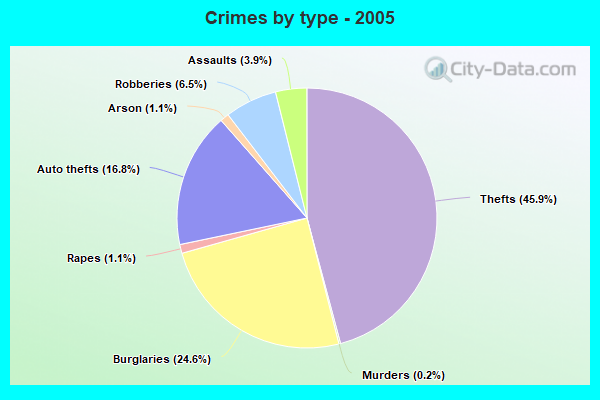
Violent crime rate in 2005
| Dayton: | 417.2 |
| U.S. Average: | 227.0 |
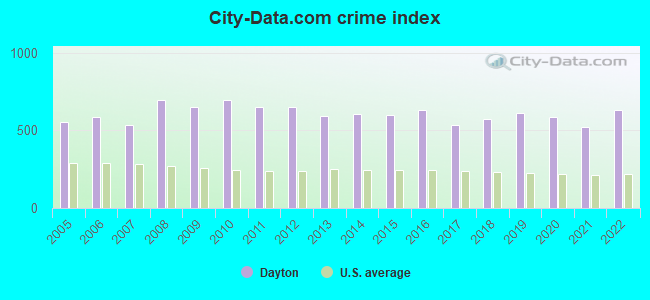
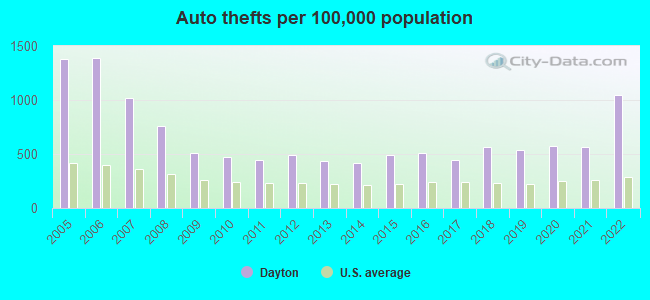
Property crime rate in 2022
| Dayton: | 465.8 |
| U.S. Average: | 166.5 |
Property crime rate in 2021
| Dayton: | 377.4 |
| U.S. Average: | 157.8 |
Property crime rate in 2020
| Dayton: | 400.4 |
| U.S. Average: | 169.6 |
Property crime rate in 2019
| Dayton: | 423.1 |
| U.S. Average: | 179.7 |
Property crime rate in 2018
| Dayton: | 464.8 |
| U.S. Average: | 190.2 |
Property crime rate in 2017
| Dayton: | 454.2 |
| U.S. Average: | 206.4 |
Property crime rate in 2016
| Dayton: | 552.5 |
| U.S. Average: | 216.6 |
Property crime rate in 2015
| Dayton: | 563.9 |
| U.S. Average: | 221.5 |
Property crime rate in 2014
| Dayton: | 633.8 |
| U.S. Average: | 230.8 |
Property crime rate in 2013
| Dayton: | 596.1 |
| U.S. Average: | 250.4 |
Property crime rate in 2012
| Dayton: | 670.7 |
| U.S. Average: | 267.3 |
Property crime rate in 2011
| Dayton: | 677.3 |
| U.S. Average: | 273.5 |
Property crime rate in 2010
| Dayton: | 722.9 |
| U.S. Average: | 276.4 |
Property crime rate in 2009
| Dayton: | 662.5 |
| U.S. Average: | 285.6 |
Property crime rate in 2008
| Dayton: | 698.4 |
| U.S. Average: | 302.2 |
Property crime rate in 2007
| Dayton: | 569.6 |
| U.S. Average: | 309.2 |
Property crime rate in 2006
| Dayton: | 635.2 |
| U.S. Average: | 317.3 |
Property crime rate in 2005
| Dayton: | 601.7 |
| U.S. Average: | 322.3 |
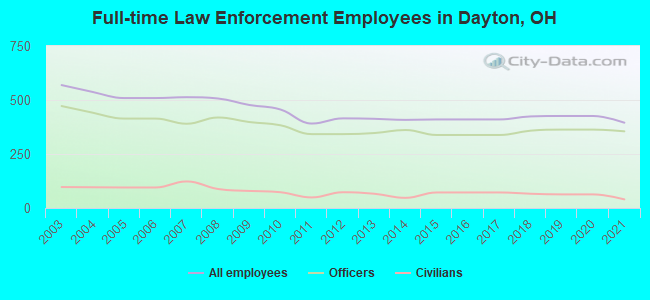
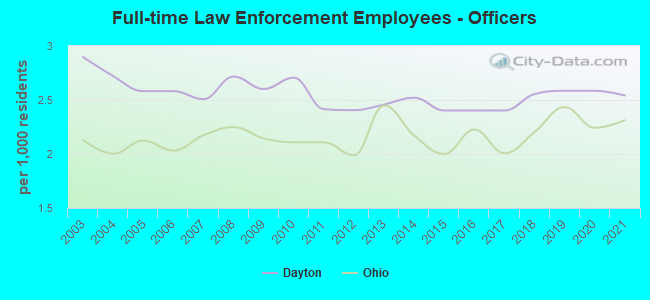
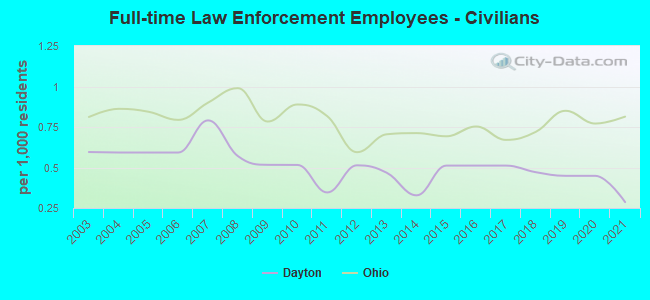
Full-time law enforcement employees in 2021, including police officers: 395 (355 officers - 308 male; 47 female).
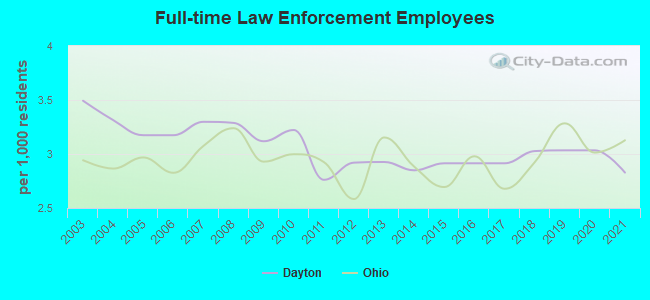
| Officers per 1,000 residents here: | 2.54 |
| Ohio average: | 2.31 |
Full-time law enforcement employees in 2019, including police officers: 426 (363 officers - 317 male; 46 female).
| Officers per 1,000 residents here: | 2.58 |
| Ohio average: | 2.43 |
Full-time law enforcement employees in 2018, including police officers: 424 (358 officers - 314 male; 44 female).
| Officers per 1,000 residents here: | 2.56 |
| Ohio average: | 2.20 |
Full-time law enforcement employees in 2015, including police officers: 410 (338 officers - 302 male; 36 female).
| Officers per 1,000 residents here: | 2.40 |
| Ohio average: | 2.00 |
Full-time law enforcement employees in 2014, including police officers: 408 (361 officers - 321 male; 40 female).
| Officers per 1,000 residents here: | 2.52 |
| Ohio average: | 2.17 |
Full-time law enforcement employees in 2013, including police officers: 413 (347 officers - 307 male; 40 female).
| Officers per 1,000 residents here: | 2.46 |
| Ohio average: | 2.45 |
Full-time law enforcement employees in 2012, including police officers: 415 (342 officers - 298 male; 44 female).
| Officers per 1,000 residents here: | 2.41 |
| Ohio average: | 1.99 |
Full-time law enforcement employees in 2011, including police officers: 391 (342 officers - 298 male; 44 female).
| Officers per 1,000 residents here: | 2.41 |
| Ohio average: | 2.11 |
Full-time law enforcement employees in 2010, including police officers: 456 (383 officers - 333 male; 50 female).
| Officers per 1,000 residents here: | 2.71 |
| Ohio average: | 2.11 |
Full-time law enforcement employees in 2009, including police officers: 477 (398 officers - 347 male; 51 female).
| Officers per 1,000 residents here: | 2.60 |
| Ohio average: | 2.15 |
Full-time law enforcement employees in 2008, including police officers: 507 (419 officers - 365 male; 54 female).
| Officers per 1,000 residents here: | 2.72 |
| Ohio average: | 2.25 |
Full-time law enforcement employees in 2007, including police officers: 513 (390 officers - 338 male; 52 female).
| Officers per 1,000 residents here: | 2.51 |
| Ohio average: | 2.17 |
Full-time law enforcement employees in 2005, including police officers: 509 (414 officers - 357 male; 57 female).
| Officers per 1,000 residents here: | 2.58 |
| Ohio average: | 2.12 |
Full-time law enforcement employees in 2004, including police officers: 537 (441 officers - 380 male; 61 female).
| Officers per 1,000 residents here: | 2.72 |
| Ohio average: | 2.00 |
Full-time law enforcement employees in 2003, including police officers: 569 (472 officers - 399 male; 73 female).
| Officers per 1,000 residents here: | 2.90 |
| Ohio average: | 2.13 |
Zip codes: 45377, 45402, 45403, 45404, 45405, 45406, 45409, 45410, 45414, 45416, 45417, 45419, 45420, 45424, 45426, 45428.