Crime rate in Indianapolis, Indiana (IN): murders, rapes, robberies, assaults, burglaries, thefts, auto thefts, arson, law enforcement employees, police officers, crime map
Crime rate in Indianapolis, IN
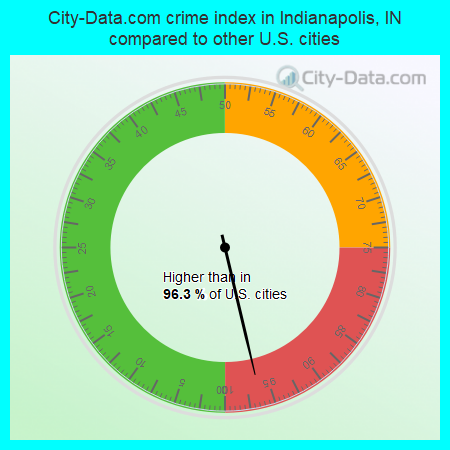
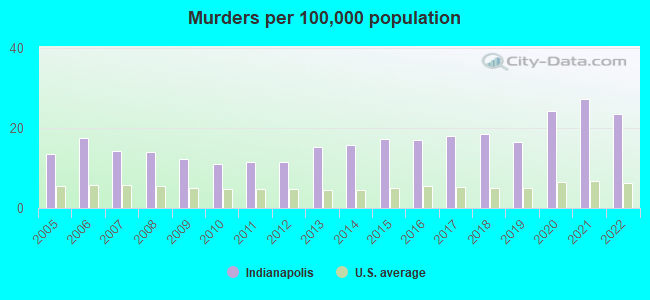
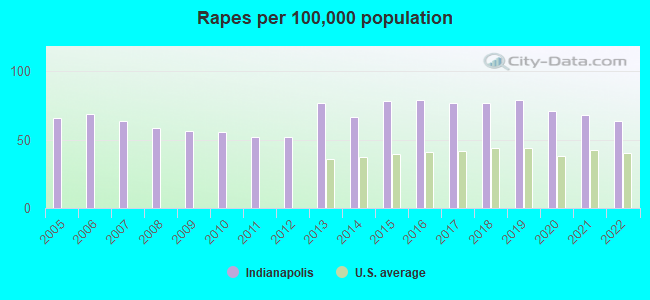
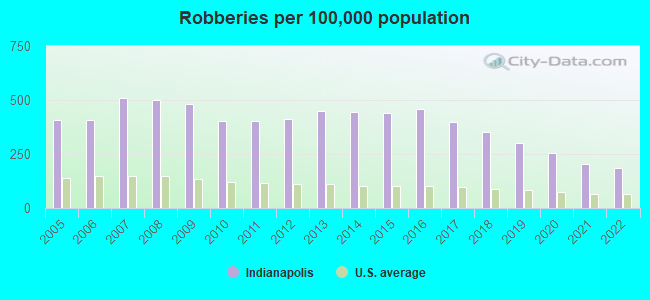
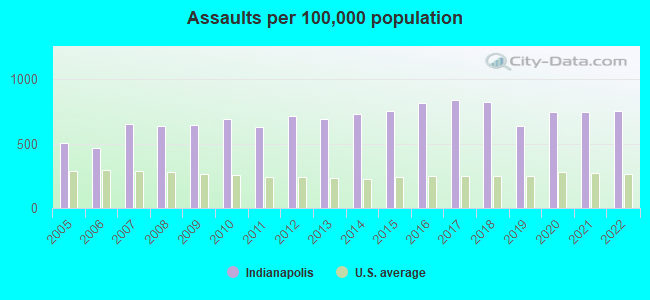
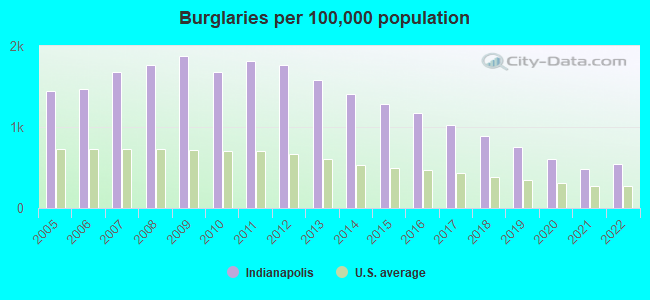
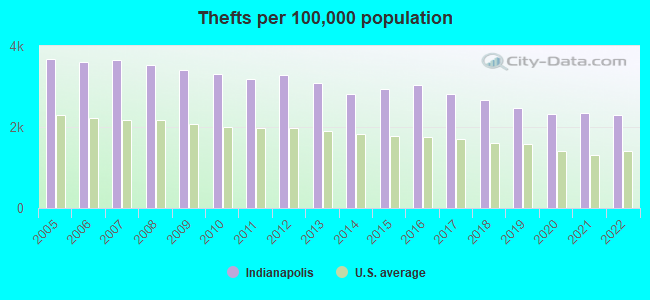
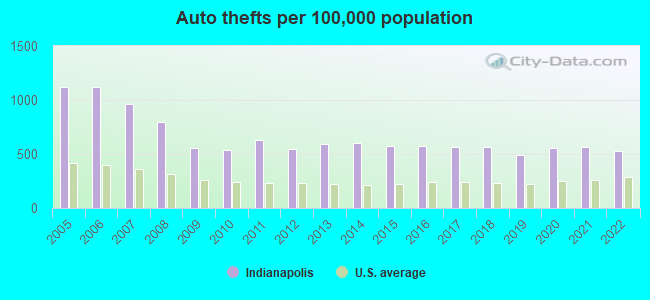
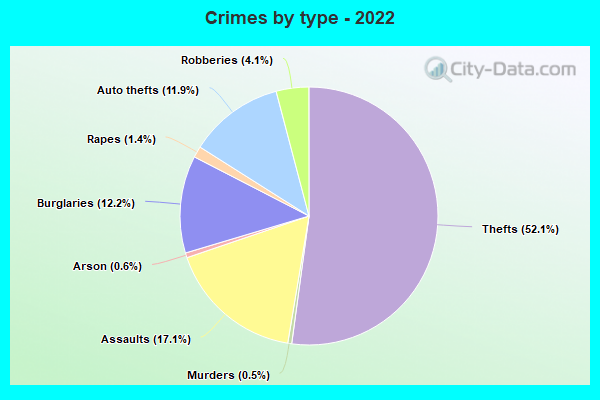
The 2022 crime rate in Indianapolis, IN is 477 (City-Data.com crime index), which is 1.9 times greater than the U.S. average. It was higher than in 96.3% U.S. cities. The 2022 Indianapolis crime rate fell by 3% compared to 2021. The number of homicides stood at 208 - a decrease of 37 compared to 2021. In the last 5 years Indianapolis has seen decreasing violent crime and decline of property crime.See how dangerous Indianapolis, IN is compared to the nearest cities:
(Note: Higher means more crime)
(Note: Higher means more crime)
| Indianapolis: | 476.7 |
| Speedway: | 247.8 |
| Beech Grove: | 263.2 |
| Lawrence: | 218.1 |
| Cumberland: | 246.6 |
| Greenwood: | 120.5 |
| Carmel: | 63.5 |
| Avon: | 161.2 |
| Zionsville: | 22.7 |

The City-Data.com crime index weighs serious crimes and violent crimes more heavily. Higher means more crime, U.S. average is 246.1. It adjusts for the number of visitors and daily workers commuting into cities.
- means the value is much bigger than the state average.
According to our research of Indiana and other state lists, there were 82 registered sex offenders living in Indianapolis, Indiana as of May 15, 2024.
The ratio of all residents to sex offenders in Indianapolis is 10,396 to 1.
The ratio of registered sex offenders to all residents in this city is much lower than the state average.
Violent crime rate in 2022
| Indianapolis: | 580.9 |
| U.S. Average: | 219.8 |
Violent crime rate in 2021
| Indianapolis: | 597.9 |
| U.S. Average: | 224.8 |
Violent crime rate in 2020
| Indianapolis: | 619.7 |
| U.S. Average: | 228.2 |
Violent crime rate in 2019
| Indianapolis: | 581.2 |
| U.S. Average: | 219.9 |
Violent crime rate in 2018
| Indianapolis: | 702.7 |
| U.S. Average: | 221.2 |
Violent crime rate in 2017
| Indianapolis: | 732.2 |
| U.S. Average: | 226.2 |
Violent crime rate in 2016
| Indianapolis: | 752.3 |
| U.S. Average: | 227.3 |
Violent crime rate in 2015
| Indianapolis: | 708.9 |
| U.S. Average: | 219.3 |
Violent crime rate in 2014
| Indianapolis: | 684.5 |
| U.S. Average: | 211.1 |
Violent crime rate in 2013
| Indianapolis: | 677.6 |
| U.S. Average: | 214.2 |
Violent crime rate in 2012
| Indianapolis: | 636.1 |
| U.S. Average: | 187.4 |
Violent crime rate in 2011
| Indianapolis: | 593.8 |
| U.S. Average: | 187.1 |
Violent crime rate in 2010
| Indianapolis: | 624.4 |
| U.S. Average: | 195.7 |
Violent crime rate in 2009
| Indianapolis: | 646.4 |
| U.S. Average: | 208.9 |
Violent crime rate in 2008
| Indianapolis: | 652.7 |
| U.S. Average: | 222.5 |
Violent crime rate in 2007
| Indianapolis: | 564.4 |
| U.S. Average: | 229.1 |
Violent crime rate in 2006
| Indianapolis: | 455.1 |
| U.S. Average: | 232.6 |
Violent crime rate in 2005
| Indianapolis: | 462.9 |
| U.S. Average: | 227.0 |
Property crime rate in 2022
| Indianapolis: | 302.9 |
| U.S. Average: | 166.5 |
Property crime rate in 2021
| Indianapolis: | 299.1 |
| U.S. Average: | 157.8 |
Property crime rate in 2020
| Indianapolis: | 321.4 |
| U.S. Average: | 169.6 |
Property crime rate in 2019
| Indianapolis: | 347.9 |
| U.S. Average: | 179.7 |
Property crime rate in 2018
| Indianapolis: | 396.9 |
| U.S. Average: | 190.2 |
Property crime rate in 2017
| Indianapolis: | 431.0 |
| U.S. Average: | 206.4 |
Property crime rate in 2016
| Indianapolis: | 474.2 |
| U.S. Average: | 216.6 |
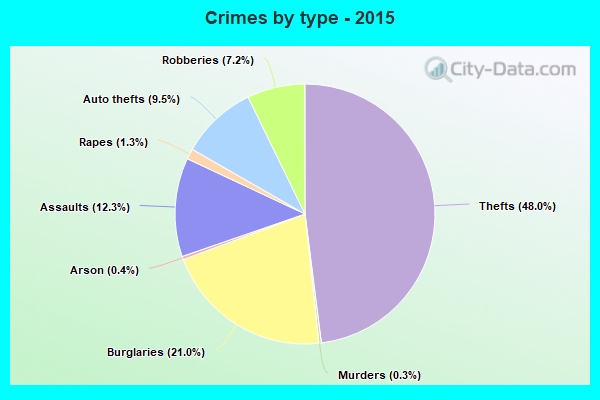
Property crime rate in 2015
| Indianapolis: | 489.8 |
| U.S. Average: | 221.5 |
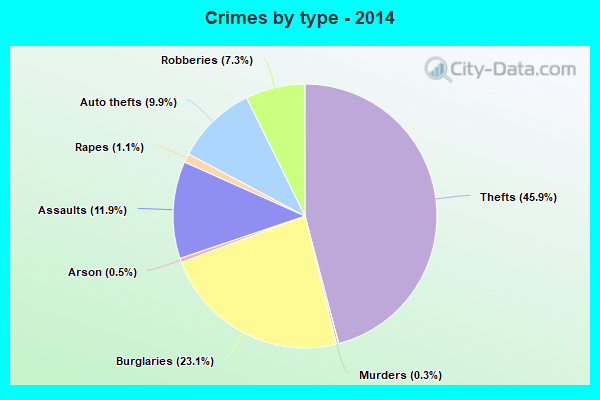
Property crime rate in 2014
| Indianapolis: | 513.4 |
| U.S. Average: | 230.8 |
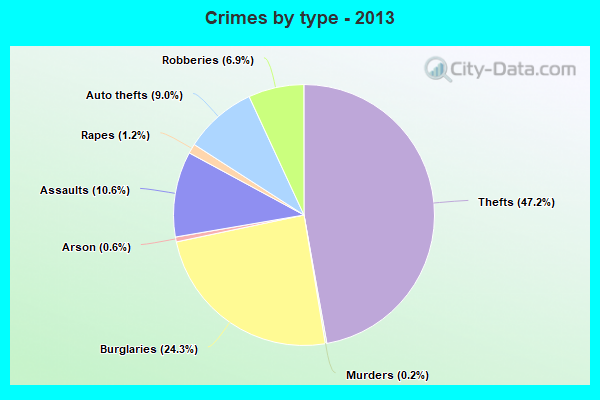
Property crime rate in 2013
| Indianapolis: | 558.4 |
| U.S. Average: | 250.4 |
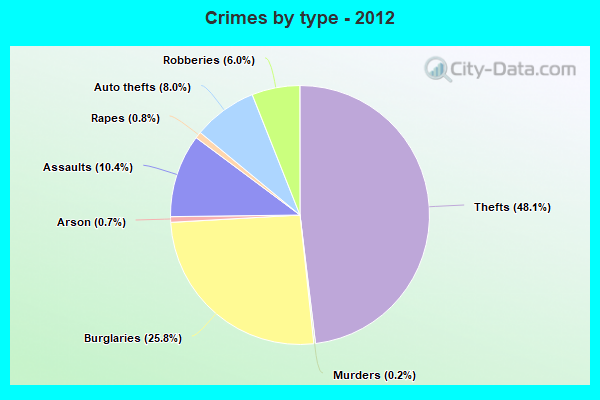
Property crime rate in 2012
| Indianapolis: | 598.7 |
| U.S. Average: | 267.3 |
Property crime rate in 2011
| Indianapolis: | 617.3 |
| U.S. Average: | 273.5 |
Property crime rate in 2010
| Indianapolis: | 581.6 |
| U.S. Average: | 276.4 |
Property crime rate in 2009
| Indianapolis: | 627.2 |
| U.S. Average: | 285.6 |
Property crime rate in 2008
| Indianapolis: | 648.7 |
| U.S. Average: | 302.2 |
Property crime rate in 2007
| Indianapolis: | 558.8 |
| U.S. Average: | 309.2 |
Property crime rate in 2006
| Indianapolis: | 539.7 |
| U.S. Average: | 317.3 |
Property crime rate in 2005
| Indianapolis: | 540.4 |
| U.S. Average: | 322.3 |
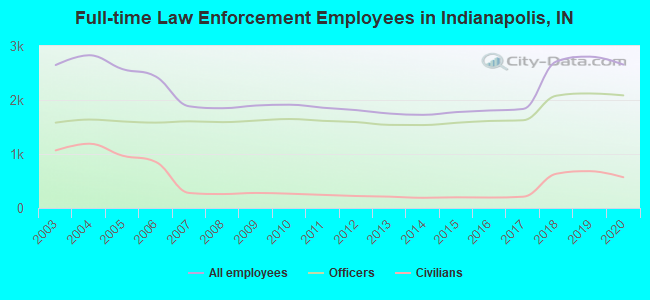
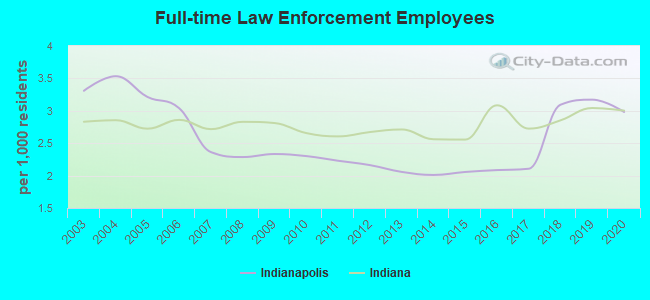
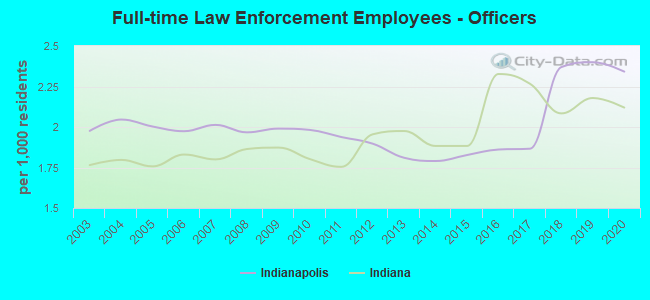
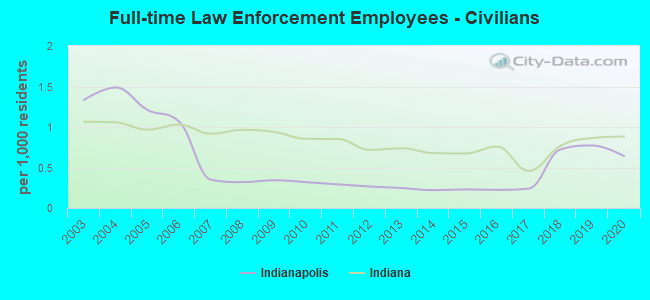
Full-time law enforcement employees in 2020, including police officers: 2,656 (2,086 officers - 1,788 male; 298 female).
| Officers per 1,000 residents here: | 2.34 |
| Indiana average: | 2.12 |
Full-time law enforcement employees in 2019, including police officers: 2,803 (2,121 officers - 1,826 male; 295 female).
| Officers per 1,000 residents here: | 2.40 |
| Indiana average: | 2.18 |
Full-time law enforcement employees in 2018, including police officers: 2,715 (2,080 officers - 1,777 male; 303 female).
| Officers per 1,000 residents here: | 2.37 |
| Indiana average: | 2.08 |
Full-time law enforcement employees in 2017, including police officers: 1,834 (1,625 officers - 1,421 male; 204 female).
| Officers per 1,000 residents here: | 1.87 |
| Indiana average: | 2.27 |
Full-time law enforcement employees in 2016, including police officers: 1,806 (1,612 officers - 1,401 male; 211 female).
| Officers per 1,000 residents here: | 1.86 |
| Indiana average: | 2.33 |
Full-time law enforcement employees in 2015, including police officers: 1,776 (1,578 officers - 1,369 male; 209 female).
| Officers per 1,000 residents here: | 1.83 |
| Indiana average: | 1.88 |
Full-time law enforcement employees in 2014, including police officers: 1,725 (1,536 officers - 1,337 male; 199 female).
| Officers per 1,000 residents here: | 1.79 |
| Indiana average: | 1.88 |
Full-time law enforcement employees in 2013, including police officers: 1,749 (1,539 officers - 1,341 male; 198 female).
| Officers per 1,000 residents here: | 1.81 |
| Indiana average: | 1.97 |
Full-time law enforcement employees in 2012, including police officers: 1,813 (1,591 officers - 1,385 male; 206 female).
| Officers per 1,000 residents here: | 1.90 |
| Indiana average: | 1.96 |
Full-time law enforcement employees in 2011, including police officers: 1,857 (1,614 officers - 1,407 male; 207 female).
| Officers per 1,000 residents here: | 1.94 |
| Indiana average: | 1.75 |
Full-time law enforcement employees in 2010, including police officers: 1,913 (1,648 officers - 1,438 male; 210 female).
| Officers per 1,000 residents here: | 1.98 |
| Indiana average: | 1.80 |
Full-time law enforcement employees in 2009, including police officers: 1,898 (1,619 officers - 1,413 male; 206 female).
| Officers per 1,000 residents here: | 1.99 |
| Indiana average: | 1.87 |
Full-time law enforcement employees in 2008, including police officers: 1,848 (1,590 officers - 1,387 male; 203 female).
| Officers per 1,000 residents here: | 1.97 |
| Indiana average: | 1.86 |
Full-time law enforcement employees in 2007, including police officers: 1,883 (1,605 officers - 1,400 male; 205 female).
| Officers per 1,000 residents here: | 2.01 |
| Indiana average: | 1.80 |
Full-time law enforcement employees in 2006, including police officers: 2,434 (1,581 officers - 1,379 male; 202 female).
| Officers per 1,000 residents here: | 1.97 |
| Indiana average: | 1.83 |
Full-time law enforcement employees in 2005, including police officers: 2,572 (1,603 officers - 1,401 male; 202 female).
| Officers per 1,000 residents here: | 2.00 |
| Indiana average: | 1.76 |
Full-time law enforcement employees in 2004, including police officers: 2,829 (1,638 officers - 1,426 male; 212 female).
| Officers per 1,000 residents here: | 2.05 |
| Indiana average: | 1.80 |
Full-time law enforcement employees in 2003, including police officers: 2,648 (1,581 officers - 1,370 male; 211 female).
| Officers per 1,000 residents here: | 1.98 |
| Indiana average: | 1.77 |


Zip codes: 46113, 46183, 46201, 46202, 46204, 46205, 46208, 46214, 46217, 46218, 46219, 46220, 46221, 46222, 46224, 46225, 46226, 46235, 46236, 46239, 46241, 46254, 46259, 46268, 46278.