Estimated zip code population in 2022: 16,333
Zip code population in 2010: 14,063
Zip code population in 2000: 6,666
Houses and condos: 6,426
Renter-occupied apartments: 1,234
% of renters here:
20%State:
29%
March 2022 cost of living index in zip code 46113: 88.4
(less than average, U.S. average is 100)
Land area: 16.4
sq. mi.
Water area: 0.1
sq. mi.
Population density: 996 people per square mile (low).
OSM Map
General Map
Google Map
MSN Map
OSM Map
General Map
Google Map
MSN Map
OSM Map
General Map
Google Map
MSN Map
OSM Map
General Map
Google Map
MSN Map
Please wait while loading the map...
Real estate property taxes paid for housing units in 2022:
This zip code:
0.6% ($1,420)Indiana:
0.7% ($1,467)
Median real estate property taxes paid for housing units with mortgages in 2022: $1,472 (0.7%)
Median real estate property taxes paid for housing units with no mortgage in 2022: $1,321 (0.6%)
Profiles of local businesses
Business Search - 14 Million verified businesses
Males: 8,367 Females: 7,965
For population 25 years and over in 46113:
High school or higher: 92.7%Bachelor's degree or higher: 23.2%Graduate or professional degree: 5.4%Unemployed: 3.6%Mean travel time to work (commute): 26.4 minutes
For population 15 years and over in 46113:
Never married: 24.3%Now married: 56.9%Separated: 0.8%Widowed: 6.2%Divorced: 11.8%
Zip code 46113 compared to state average:
House age significantly below state average. 12,831 78.6% White 2,239 13.7% Black 787 4.8% Hispanic or Latino 321 2.0% Two or more races 138 0.8% Asian 14 0.09% Some other race
Data:
Median household income ($)
Median household income (% change since 2000)
Household income diversity
Ratio of average income to average house value (%)
Ratio of average income to average rent
Median household income ($) - White
Median household income ($) - Black or African American
Median household income ($) - Asian
Median household income ($) - Hispanic or Latino
Median household income ($) - American Indian and Alaska Native
Median household income ($) - Multirace
Median household income ($) - Other Race
Median household income for houses/condos with a mortgage ($)
Median household income for apartments without a mortgage ($)
Races - White alone (%)
Races - White alone (% change since 2000)
Races - Black alone (%)
Races - Black alone (% change since 2000)
Races - American Indian alone (%)
Races - American Indian alone (% change since 2000)
Races - Asian alone (%)
Races - Asian alone (% change since 2000)
Races - Hispanic (%)
Races - Hispanic (% change since 2000)
Races - Native Hawaiian and Other Pacific Islander alone (%)
Races - Native Hawaiian and Other Pacific Islander alone (% change since 2000)
Races - Two or more races (%)
Races - Two or more races (% change since 2000)
Races - Other race alone (%)
Races - Other race alone (% change since 2000)
Racial diversity
Unemployment (%)
Unemployment (% change since 2000)
Unemployment (%) - White
Unemployment (%) - Black or African American
Unemployment (%) - Asian
Unemployment (%) - Hispanic or Latino
Unemployment (%) - American Indian and Alaska Native
Unemployment (%) - Multirace
Unemployment (%) - Other Race
Population density (people per square mile)
Population - Males (%)
Population - Females (%)
Population - Males (%) - White
Population - Males (%) - Black or African American
Population - Males (%) - Asian
Population - Males (%) - Hispanic or Latino
Population - Males (%) - American Indian and Alaska Native
Population - Males (%) - Multirace
Population - Males (%) - Other Race
Population - Females (%) - White
Population - Females (%) - Black or African American
Population - Females (%) - Asian
Population - Females (%) - Hispanic or Latino
Population - Females (%) - American Indian and Alaska Native
Population - Females (%) - Multirace
Population - Females (%) - Other Race
Coronavirus confirmed cases (May 15, 2024)
Deaths caused by coronavirus (May 15, 2024)
Coronavirus confirmed cases (per 100k population) (May 15, 2024)
Deaths caused by coronavirus (per 100k population) (May 15, 2024)
Daily increase in number of cases (May 15, 2024)
Weekly increase in number of cases (May 15, 2024)
Cases doubled (in days) (May 15, 2024)
Hospitalized patients (Apr 18, 2022)
Negative test results (Apr 18, 2022)
Total test results (Apr 18, 2022)
COVID Vaccine doses distributed (per 100k population) (Sep 19, 2023)
COVID Vaccine doses administered (per 100k population) (Sep 19, 2023)
COVID Vaccine doses distributed (Sep 19, 2023)
COVID Vaccine doses administered (Sep 19, 2023)
Likely homosexual households (%)
Likely homosexual households (% change since 2000)
Likely homosexual households - Lesbian couples (%)
Likely homosexual households - Lesbian couples (% change since 2000)
Likely homosexual households - Gay men (%)
Likely homosexual households - Gay men (% change since 2000)
Cost of living index
Median gross rent ($)
Median contract rent ($)
Median monthly housing costs ($)
Median house or condo value ($)
Median house or condo value ($ change since 2000)
Mean house or condo value by units in structure - 1, detached ($)
Mean house or condo value by units in structure - 1, attached ($)
Mean house or condo value by units in structure - 2 ($)
Mean house or condo value by units in structure by units in structure - 3 or 4 ($)
Mean house or condo value by units in structure - 5 or more ($)
Mean house or condo value by units in structure - Boat, RV, van, etc. ($)
Mean house or condo value by units in structure - Mobile home ($)
Median house or condo value ($) - White
Median house or condo value ($) - Black or African American
Median house or condo value ($) - Asian
Median house or condo value ($) - Hispanic or Latino
Median house or condo value ($) - American Indian and Alaska Native
Median house or condo value ($) - Multirace
Median house or condo value ($) - Other Race
Median resident age
Resident age diversity
Median resident age - Males
Median resident age - Females
Median resident age - White
Median resident age - Black or African American
Median resident age - Asian
Median resident age - Hispanic or Latino
Median resident age - American Indian and Alaska Native
Median resident age - Multirace
Median resident age - Other Race
Median resident age - Males - White
Median resident age - Males - Black or African American
Median resident age - Males - Asian
Median resident age - Males - Hispanic or Latino
Median resident age - Males - American Indian and Alaska Native
Median resident age - Males - Multirace
Median resident age - Males - Other Race
Median resident age - Females - White
Median resident age - Females - Black or African American
Median resident age - Females - Asian
Median resident age - Females - Hispanic or Latino
Median resident age - Females - American Indian and Alaska Native
Median resident age - Females - Multirace
Median resident age - Females - Other Race
Commute - mean travel time to work (minutes)
Travel time to work - Less than 5 minutes (%)
Travel time to work - Less than 5 minutes (% change since 2000)
Travel time to work - 5 to 9 minutes (%)
Travel time to work - 5 to 9 minutes (% change since 2000)
Travel time to work - 10 to 19 minutes (%)
Travel time to work - 10 to 19 minutes (% change since 2000)
Travel time to work - 20 to 29 minutes (%)
Travel time to work - 20 to 29 minutes (% change since 2000)
Travel time to work - 30 to 39 minutes (%)
Travel time to work - 30 to 39 minutes (% change since 2000)
Travel time to work - 40 to 59 minutes (%)
Travel time to work - 40 to 59 minutes (% change since 2000)
Travel time to work - 60 to 89 minutes (%)
Travel time to work - 60 to 89 minutes (% change since 2000)
Travel time to work - 90 or more minutes (%)
Travel time to work - 90 or more minutes (% change since 2000)
Marital status - Never married (%)
Marital status - Now married (%)
Marital status - Separated (%)
Marital status - Widowed (%)
Marital status - Divorced (%)
Median family income ($)
Median family income (% change since 2000)
Median non-family income ($)
Median non-family income (% change since 2000)
Median per capita income ($)
Median per capita income (% change since 2000)
Median family income ($) - White
Median family income ($) - Black or African American
Median family income ($) - Asian
Median family income ($) - Hispanic or Latino
Median family income ($) - American Indian and Alaska Native
Median family income ($) - Multirace
Median family income ($) - Other Race
Median year house/condo built
Median year apartment built
Year house built - Built 2005 or later (%)
Year house built - Built 2000 to 2004 (%)
Year house built - Built 1990 to 1999 (%)
Year house built - Built 1980 to 1989 (%)
Year house built - Built 1970 to 1979 (%)
Year house built - Built 1960 to 1969 (%)
Year house built - Built 1950 to 1959 (%)
Year house built - Built 1940 to 1949 (%)
Year house built - Built 1939 or earlier (%)
Average household size
Household density (households per square mile)
Average household size - White
Average household size - Black or African American
Average household size - Asian
Average household size - Hispanic or Latino
Average household size - American Indian and Alaska Native
Average household size - Multirace
Average household size - Other Race
Occupied housing units (%)
Vacant housing units (%)
Owner occupied housing units (%)
Renter occupied housing units (%)
Vacancy status - For rent (%)
Vacancy status - For sale only (%)
Vacancy status - Rented or sold, not occupied (%)
Vacancy status - For seasonal, recreational, or occasional use (%)
Vacancy status - For migrant workers (%)
Vacancy status - Other vacant (%)
Residents with income below the poverty level (%)
Residents with income below 50% of the poverty level (%)
Children below poverty level (%)
Poor families by family type - Married-couple family (%)
Poor families by family type - Male, no wife present (%)
Poor families by family type - Female, no husband present (%)
Poverty status for native-born residents (%)
Poverty status for foreign-born residents (%)
Poverty among high school graduates not in families (%)
Poverty among people who did not graduate high school not in families (%)
Residents with income below the poverty level (%) - White
Residents with income below the poverty level (%) - Black or African American
Residents with income below the poverty level (%) - Asian
Residents with income below the poverty level (%) - Hispanic or Latino
Residents with income below the poverty level (%) - American Indian and Alaska Native
Residents with income below the poverty level (%) - Multirace
Residents with income below the poverty level (%) - Other Race
Air pollution - Air Quality Index (AQI)
Air pollution - CO
Air pollution - NO2
Air pollution - SO2
Air pollution - Ozone
Air pollution - PM10
Air pollution - PM25
Air pollution - Pb
Crime - Murders per 100,000 population
Crime - Rapes per 100,000 population
Crime - Robberies per 100,000 population
Crime - Assaults per 100,000 population
Crime - Burglaries per 100,000 population
Crime - Thefts per 100,000 population
Crime - Auto thefts per 100,000 population
Crime - Arson per 100,000 population
Crime - City-data.com crime index
Crime - Violent crime index
Crime - Property crime index
Crime - Murders per 100,000 population (5 year average)
Crime - Rapes per 100,000 population (5 year average)
Crime - Robberies per 100,000 population (5 year average)
Crime - Assaults per 100,000 population (5 year average)
Crime - Burglaries per 100,000 population (5 year average)
Crime - Thefts per 100,000 population (5 year average)
Crime - Auto thefts per 100,000 population (5 year average)
Crime - Arson per 100,000 population (5 year average)
Crime - City-data.com crime index (5 year average)
Crime - Violent crime index (5 year average)
Crime - Property crime index (5 year average)
1996 Presidential Elections Results (%) - Democratic Party (Clinton)
1996 Presidential Elections Results (%) - Republican Party (Dole)
1996 Presidential Elections Results (%) - Other
2000 Presidential Elections Results (%) - Democratic Party (Gore)
2000 Presidential Elections Results (%) - Republican Party (Bush)
2000 Presidential Elections Results (%) - Other
2004 Presidential Elections Results (%) - Democratic Party (Kerry)
2004 Presidential Elections Results (%) - Republican Party (Bush)
2004 Presidential Elections Results (%) - Other
2008 Presidential Elections Results (%) - Democratic Party (Obama)
2008 Presidential Elections Results (%) - Republican Party (McCain)
2008 Presidential Elections Results (%) - Other
2012 Presidential Elections Results (%) - Democratic Party (Obama)
2012 Presidential Elections Results (%) - Republican Party (Romney)
2012 Presidential Elections Results (%) - Other
2016 Presidential Elections Results (%) - Democratic Party (Clinton)
2016 Presidential Elections Results (%) - Republican Party (Trump)
2016 Presidential Elections Results (%) - Other
2020 Presidential Elections Results (%) - Democratic Party (Biden)
2020 Presidential Elections Results (%) - Republican Party (Trump)
2020 Presidential Elections Results (%) - Other
Ancestries Reported - Arab (%)
Ancestries Reported - Czech (%)
Ancestries Reported - Danish (%)
Ancestries Reported - Dutch (%)
Ancestries Reported - English (%)
Ancestries Reported - French (%)
Ancestries Reported - French Canadian (%)
Ancestries Reported - German (%)
Ancestries Reported - Greek (%)
Ancestries Reported - Hungarian (%)
Ancestries Reported - Irish (%)
Ancestries Reported - Italian (%)
Ancestries Reported - Lithuanian (%)
Ancestries Reported - Norwegian (%)
Ancestries Reported - Polish (%)
Ancestries Reported - Portuguese (%)
Ancestries Reported - Russian (%)
Ancestries Reported - Scotch-Irish (%)
Ancestries Reported - Scottish (%)
Ancestries Reported - Slovak (%)
Ancestries Reported - Subsaharan African (%)
Ancestries Reported - Swedish (%)
Ancestries Reported - Swiss (%)
Ancestries Reported - Ukrainian (%)
Ancestries Reported - United States (%)
Ancestries Reported - Welsh (%)
Ancestries Reported - West Indian (%)
Ancestries Reported - Other (%)
Educational Attainment - No schooling completed (%)
Educational Attainment - Less than high school (%)
Educational Attainment - High school or equivalent (%)
Educational Attainment - Less than 1 year of college (%)
Educational Attainment - 1 or more years of college (%)
Educational Attainment - Associate degree (%)
Educational Attainment - Bachelor's degree (%)
Educational Attainment - Master's degree (%)
Educational Attainment - Professional school degree (%)
Educational Attainment - Doctorate degree (%)
School Enrollment - Nursery, preschool (%)
School Enrollment - Kindergarten (%)
School Enrollment - Grade 1 to 4 (%)
School Enrollment - Grade 5 to 8 (%)
School Enrollment - Grade 9 to 12 (%)
School Enrollment - College undergrad (%)
School Enrollment - Graduate or professional (%)
School Enrollment - Not enrolled in school (%)
School enrollment - Public schools (%)
School enrollment - Private schools (%)
School enrollment - Not enrolled (%)
Median number of rooms in houses and condos
Median number of rooms in apartments
Housing units lacking complete plumbing facilities (%)
Housing units lacking complete kitchen facilities (%)
Density of houses
Urban houses (%)
Rural houses (%)
Households with people 60 years and over (%)
Households with people 65 years and over (%)
Households with people 75 years and over (%)
Households with one or more nonrelatives (%)
Households with no nonrelatives (%)
Population in households (%)
Family households (%)
Nonfamily households (%)
Population in families (%)
Family households with own children (%)
Median number of bedrooms in owner occupied houses
Mean number of bedrooms in owner occupied houses
Median number of bedrooms in renter occupied houses
Mean number of bedrooms in renter occupied houses
Median number of vehichles in owner occupied houses
Mean number of vehichles in owner occupied houses
Median number of vehichles in renter occupied houses
Mean number of vehichles in renter occupied houses
Mortgage status - with mortgage (%)
Mortgage status - with second mortgage (%)
Mortgage status - with home equity loan (%)
Mortgage status - with both second mortgage and home equity loan (%)
Mortgage status - without a mortgage (%)
Average family size
Average family size - White
Average family size - Black or African American
Average family size - Asian
Average family size - Hispanic or Latino
Average family size - American Indian and Alaska Native
Average family size - Multirace
Average family size - Other Race
Geographical mobility - Same house 1 year ago (%)
Geographical mobility - Moved within same county (%)
Geographical mobility - Moved from different county within same state (%)
Geographical mobility - Moved from different state (%)
Geographical mobility - Moved from abroad (%)
Place of birth - Born in state of residence (%)
Place of birth - Born in other state (%)
Place of birth - Native, outside of US (%)
Place of birth - Foreign born (%)
Housing units in structures - 1, detached (%)
Housing units in structures - 1, attached (%)
Housing units in structures - 2 (%)
Housing units in structures - 3 or 4 (%)
Housing units in structures - 5 to 9 (%)
Housing units in structures - 10 to 19 (%)
Housing units in structures - 20 to 49 (%)
Housing units in structures - 50 or more (%)
Housing units in structures - Mobile home (%)
Housing units in structures - Boat, RV, van, etc. (%)
House/condo owner moved in on average (years ago)
Renter moved in on average (years ago)
Year householder moved into unit - Moved in 1999 to March 2000 (%)
Year householder moved into unit - Moved in 1995 to 1998 (%)
Year householder moved into unit - Moved in 1990 to 1994 (%)
Year householder moved into unit - Moved in 1980 to 1989 (%)
Year householder moved into unit - Moved in 1970 to 1979 (%)
Year householder moved into unit - Moved in 1969 or earlier (%)
Means of transportation to work - Drove car alone (%)
Means of transportation to work - Carpooled (%)
Means of transportation to work - Public transportation (%)
Means of transportation to work - Bus or trolley bus (%)
Means of transportation to work - Streetcar or trolley car (%)
Means of transportation to work - Subway or elevated (%)
Means of transportation to work - Railroad (%)
Means of transportation to work - Ferryboat (%)
Means of transportation to work - Taxicab (%)
Means of transportation to work - Motorcycle (%)
Means of transportation to work - Bicycle (%)
Means of transportation to work - Walked (%)
Means of transportation to work - Other means (%)
Working at home (%)
Industry diversity
Most Common Industries - Agriculture, forestry, fishing and hunting, and mining (%)
Most Common Industries - Agriculture, forestry, fishing and hunting (%)
Most Common Industries - Mining, quarrying, and oil and gas extraction (%)
Most Common Industries - Construction (%)
Most Common Industries - Manufacturing (%)
Most Common Industries - Wholesale trade (%)
Most Common Industries - Retail trade (%)
Most Common Industries - Transportation and warehousing, and utilities (%)
Most Common Industries - Transportation and warehousing (%)
Most Common Industries - Utilities (%)
Most Common Industries - Information (%)
Most Common Industries - Finance and insurance, and real estate and rental and leasing (%)
Most Common Industries - Finance and insurance (%)
Most Common Industries - Real estate and rental and leasing (%)
Most Common Industries - Professional, scientific, and management, and administrative and waste management services (%)
Most Common Industries - Professional, scientific, and technical services (%)
Most Common Industries - Management of companies and enterprises (%)
Most Common Industries - Administrative and support and waste management services (%)
Most Common Industries - Educational services, and health care and social assistance (%)
Most Common Industries - Educational services (%)
Most Common Industries - Health care and social assistance (%)
Most Common Industries - Arts, entertainment, and recreation, and accommodation and food services (%)
Most Common Industries - Arts, entertainment, and recreation (%)
Most Common Industries - Accommodation and food services (%)
Most Common Industries - Other services, except public administration (%)
Most Common Industries - Public administration (%)
Occupation diversity
Most Common Occupations - Management, business, science, and arts occupations (%)
Most Common Occupations - Management, business, and financial occupations (%)
Most Common Occupations - Management occupations (%)
Most Common Occupations - Business and financial operations occupations (%)
Most Common Occupations - Computer, engineering, and science occupations (%)
Most Common Occupations - Computer and mathematical occupations (%)
Most Common Occupations - Architecture and engineering occupations (%)
Most Common Occupations - Life, physical, and social science occupations (%)
Most Common Occupations - Education, legal, community service, arts, and media occupations (%)
Most Common Occupations - Community and social service occupations (%)
Most Common Occupations - Legal occupations (%)
Most Common Occupations - Education, training, and library occupations (%)
Most Common Occupations - Arts, design, entertainment, sports, and media occupations (%)
Most Common Occupations - Healthcare practitioners and technical occupations (%)
Most Common Occupations - Health diagnosing and treating practitioners and other technical occupations (%)
Most Common Occupations - Health technologists and technicians (%)
Most Common Occupations - Service occupations (%)
Most Common Occupations - Healthcare support occupations (%)
Most Common Occupations - Protective service occupations (%)
Most Common Occupations - Fire fighting and prevention, and other protective service workers including supervisors (%)
Most Common Occupations - Law enforcement workers including supervisors (%)
Most Common Occupations - Food preparation and serving related occupations (%)
Most Common Occupations - Building and grounds cleaning and maintenance occupations (%)
Most Common Occupations - Personal care and service occupations (%)
Most Common Occupations - Sales and office occupations (%)
Most Common Occupations - Sales and related occupations (%)
Most Common Occupations - Office and administrative support occupations (%)
Most Common Occupations - Natural resources, construction, and maintenance occupations (%)
Most Common Occupations - Farming, fishing, and forestry occupations (%)
Most Common Occupations - Construction and extraction occupations (%)
Most Common Occupations - Installation, maintenance, and repair occupations (%)
Most Common Occupations - Production, transportation, and material moving occupations (%)
Most Common Occupations - Production occupations (%)
Most Common Occupations - Transportation occupations (%)
Most Common Occupations - Material moving occupations (%)
People in Group quarters - Institutionalized population (%)
People in Group quarters - Correctional institutions (%)
People in Group quarters - Federal prisons and detention centers (%)
People in Group quarters - Halfway houses (%)
People in Group quarters - Local jails and other confinement facilities (including police lockups) (%)
People in Group quarters - Military disciplinary barracks (%)
People in Group quarters - State prisons (%)
People in Group quarters - Other types of correctional institutions (%)
People in Group quarters - Nursing homes (%)
People in Group quarters - Hospitals/wards, hospices, and schools for the handicapped (%)
People in Group quarters - Hospitals/wards and hospices for chronically ill (%)
People in Group quarters - Hospices or homes for chronically ill (%)
People in Group quarters - Military hospitals or wards for chronically ill (%)
People in Group quarters - Other hospitals or wards for chronically ill (%)
People in Group quarters - Hospitals or wards for drug/alcohol abuse (%)
People in Group quarters - Mental (Psychiatric) hospitals or wards (%)
People in Group quarters - Schools, hospitals, or wards for the mentally retarded (%)
People in Group quarters - Schools, hospitals, or wards for the physically handicapped (%)
People in Group quarters - Institutions for the deaf (%)
People in Group quarters - Institutions for the blind (%)
People in Group quarters - Orthopedic wards and institutions for the physically handicapped (%)
People in Group quarters - Wards in general hospitals for patients who have no usual home elsewhere (%)
People in Group quarters - Wards in military hospitals for patients who have no usual home elsewhere (%)
People in Group quarters - Juvenile institutions (%)
People in Group quarters - Long-term care (%)
People in Group quarters - Homes for abused, dependent, and neglected children (%)
People in Group quarters - Residential treatment centers for emotionally disturbed children (%)
People in Group quarters - Training schools for juvenile delinquents (%)
People in Group quarters - Short-term care, detention or diagnostic centers for delinquent children (%)
People in Group quarters - Type of juvenile institution unknown (%)
People in Group quarters - Noninstitutionalized population (%)
People in Group quarters - College dormitories (includes college quarters off campus) (%)
People in Group quarters - Military quarters (%)
People in Group quarters - On base (%)
People in Group quarters - Barracks, unaccompanied personnel housing (UPH), (Enlisted/Officer), ;and similar group living quarters for military personnel (%)
People in Group quarters - Transient quarters for temporary residents (%)
People in Group quarters - Military ships (%)
People in Group quarters - Group homes (%)
People in Group quarters - Homes or halfway houses for drug/alcohol abuse (%)
People in Group quarters - Homes for the mentally ill (%)
People in Group quarters - Homes for the mentally retarded (%)
People in Group quarters - Homes for the physically handicapped (%)
People in Group quarters - Other group homes (%)
People in Group quarters - Religious group quarters (%)
People in Group quarters - Dormitories (%)
People in Group quarters - Agriculture workers' dormitories on farms (%)
People in Group quarters - Job Corps and vocational training facilities (%)
People in Group quarters - Other workers' dormitories (%)
People in Group quarters - Crews of maritime vessels (%)
People in Group quarters - Other nonhousehold living situations (%)
People in Group quarters - Other noninstitutional group quarters (%)
Residents speaking English at home (%)
Residents speaking English at home - Born in the United States (%)
Residents speaking English at home - Native, born elsewhere (%)
Residents speaking English at home - Foreign born (%)
Residents speaking Spanish at home (%)
Residents speaking Spanish at home - Born in the United States (%)
Residents speaking Spanish at home - Native, born elsewhere (%)
Residents speaking Spanish at home - Foreign born (%)
Residents speaking other language at home (%)
Residents speaking other language at home - Born in the United States (%)
Residents speaking other language at home - Native, born elsewhere (%)
Residents speaking other language at home - Foreign born (%)
Class of Workers - Employee of private company (%)
Class of Workers - Self-employed in own incorporated business (%)
Class of Workers - Private not-for-profit wage and salary workers (%)
Class of Workers - Local government workers (%)
Class of Workers - State government workers (%)
Class of Workers - Federal government workers (%)
Class of Workers - Self-employed workers in own not incorporated business and Unpaid family workers (%)
House heating fuel used in houses and condos - Utility gas (%)
House heating fuel used in houses and condos - Bottled, tank, or LP gas (%)
House heating fuel used in houses and condos - Electricity (%)
House heating fuel used in houses and condos - Fuel oil, kerosene, etc. (%)
House heating fuel used in houses and condos - Coal or coke (%)
House heating fuel used in houses and condos - Wood (%)
House heating fuel used in houses and condos - Solar energy (%)
House heating fuel used in houses and condos - Other fuel (%)
House heating fuel used in houses and condos - No fuel used (%)
House heating fuel used in apartments - Utility gas (%)
House heating fuel used in apartments - Bottled, tank, or LP gas (%)
House heating fuel used in apartments - Electricity (%)
House heating fuel used in apartments - Fuel oil, kerosene, etc. (%)
House heating fuel used in apartments - Coal or coke (%)
House heating fuel used in apartments - Wood (%)
House heating fuel used in apartments - Solar energy (%)
House heating fuel used in apartments - Other fuel (%)
House heating fuel used in apartments - No fuel used (%)
Armed forces status - In Armed Forces (%)
Armed forces status - Civilian (%)
Armed forces status - Civilian - Veteran (%)
Armed forces status - Civilian - Nonveteran (%)
Fatal accidents locations in years 2005-2021
Fatal accidents locations in 2005
Fatal accidents locations in 2006
Fatal accidents locations in 2007
Fatal accidents locations in 2008
Fatal accidents locations in 2009
Fatal accidents locations in 2010
Fatal accidents locations in 2011
Fatal accidents locations in 2012
Fatal accidents locations in 2013
Fatal accidents locations in 2014
Fatal accidents locations in 2015
Fatal accidents locations in 2016
Fatal accidents locations in 2017
Fatal accidents locations in 2018
Fatal accidents locations in 2019
Fatal accidents locations in 2020
Fatal accidents locations in 2021
Alcohol use - People drinking some alcohol every month (%)
Alcohol use - People not drinking at all (%)
Alcohol use - Average days/month drinking alcohol
Alcohol use - Average drinks/week
Alcohol use - Average days/year people drink much
Audiometry - Average condition of hearing (%)
Audiometry - People that can hear a whisper from across a quiet room (%)
Audiometry - People that can hear normal voice from across a quiet room (%)
Audiometry - Ears ringing, roaring, buzzing (%)
Audiometry - Had a job exposure to loud noise (%)
Audiometry - Had off-work exposure to loud noise (%)
Blood Pressure & Cholesterol - Has high blood pressure (%)
Blood Pressure & Cholesterol - Checking blood pressure at home (%)
Blood Pressure & Cholesterol - Frequently checking blood cholesterol (%)
Blood Pressure & Cholesterol - Has high cholesterol level (%)
Consumer Behavior - Money monthly spent on food at supermarket/grocery store
Consumer Behavior - Money monthly spent on food at other stores
Consumer Behavior - Money monthly spent on eating out
Consumer Behavior - Money monthly spent on carryout/delivered foods
Consumer Behavior - Income spent on food at supermarket/grocery store (%)
Consumer Behavior - Income spent on food at other stores (%)
Consumer Behavior - Income spent on eating out (%)
Consumer Behavior - Income spent on carryout/delivered foods (%)
Current Health Status - General health condition (%)
Current Health Status - Blood donors (%)
Current Health Status - Has blood ever tested for HIV virus (%)
Current Health Status - Left-handed people (%)
Dermatology - People using sunscreen (%)
Diabetes - Diabetics (%)
Diabetes - Had a blood test for high blood sugar (%)
Diabetes - People taking insulin (%)
Diet Behavior & Nutrition - Diet health (%)
Diet Behavior & Nutrition - Milk product consumption (# of products/month)
Diet Behavior & Nutrition - Meals not home prepared (#/week)
Diet Behavior & Nutrition - Meals from fast food or pizza place (#/week)
Diet Behavior & Nutrition - Ready-to-eat foods (#/month)
Diet Behavior & Nutrition - Frozen meals/pizza (#/month)
Drug Use - People that ever used marijuana or hashish (%)
Drug Use - Ever used hard drugs (%)
Drug Use - Ever used any form of cocaine (%)
Drug Use - Ever used heroin (%)
Drug Use - Ever used methamphetamine (%)
Health Insurance - People covered by health insurance (%)
Kidney Conditions-Urology - Avg. # of times urinating at night
Medical Conditions - People with asthma (%)
Medical Conditions - People with anemia (%)
Medical Conditions - People with psoriasis (%)
Medical Conditions - People with overweight (%)
Medical Conditions - Elderly people having difficulties in thinking or remembering (%)
Medical Conditions - People who ever received blood transfusion (%)
Medical Conditions - People having trouble seeing even with glass/contacts (%)
Medical Conditions - People with arthritis (%)
Medical Conditions - People with gout (%)
Medical Conditions - People with congestive heart failure (%)
Medical Conditions - People with coronary heart disease (%)
Medical Conditions - People with angina pectoris (%)
Medical Conditions - People who ever had heart attack (%)
Medical Conditions - People who ever had stroke (%)
Medical Conditions - People with emphysema (%)
Medical Conditions - People with thyroid problem (%)
Medical Conditions - People with chronic bronchitis (%)
Medical Conditions - People with any liver condition (%)
Medical Conditions - People who ever had cancer or malignancy (%)
Mental Health - People who have little interest in doing things (%)
Mental Health - People feeling down, depressed, or hopeless (%)
Mental Health - People who have trouble sleeping or sleeping too much (%)
Mental Health - People feeling tired or having little energy (%)
Mental Health - People with poor appetite or overeating (%)
Mental Health - People feeling bad about themself (%)
Mental Health - People who have trouble concentrating on things (%)
Mental Health - People moving or speaking slowly or too fast (%)
Mental Health - People having thoughts they would be better off dead (%)
Oral Health - Average years since last visit a dentist
Oral Health - People embarrassed because of mouth (%)
Oral Health - People with gum disease (%)
Oral Health - General health of teeth and gums (%)
Oral Health - Average days a week using dental floss/device
Oral Health - Average days a week using mouthwash for dental problem
Oral Health - Average number of teeth
Pesticide Use - Households using pesticides to control insects (%)
Pesticide Use - Households using pesticides to kill weeds (%)
Physical Activity - People doing vigorous-intensity work activities (%)
Physical Activity - People doing moderate-intensity work activities (%)
Physical Activity - People walking or bicycling (%)
Physical Activity - People doing vigorous-intensity recreational activities (%)
Physical Activity - People doing moderate-intensity recreational activities (%)
Physical Activity - Average hours a day doing sedentary activities
Physical Activity - Average hours a day watching TV or videos
Physical Activity - Average hours a day using computer
Physical Functioning - People having limitations keeping them from working (%)
Physical Functioning - People limited in amount of work they can do (%)
Physical Functioning - People that need special equipment to walk (%)
Physical Functioning - People experiencing confusion/memory problems (%)
Physical Functioning - People requiring special healthcare equipment (%)
Prescription Medications - Average number of prescription medicines taking
Preventive Aspirin Use - Adults 40+ taking low-dose aspirin (%)
Reproductive Health - Vaginal deliveries (%)
Reproductive Health - Cesarean deliveries (%)
Reproductive Health - Deliveries resulted in a live birth (%)
Reproductive Health - Pregnancies resulted in a delivery (%)
Reproductive Health - Women breastfeeding newborns (%)
Reproductive Health - Women that had a hysterectomy (%)
Reproductive Health - Women that had both ovaries removed (%)
Reproductive Health - Women that have ever taken birth control pills (%)
Reproductive Health - Women taking birth control pills (%)
Reproductive Health - Women that have ever used Depo-Provera or injectables (%)
Reproductive Health - Women that have ever used female hormones (%)
Sexual Behavior - People 18+ that ever had sex (vaginal, anal, or oral) (%)
Sexual Behavior - Males 18+ that ever had vaginal sex with a woman (%)
Sexual Behavior - Males 18+ that ever performed oral sex on a woman (%)
Sexual Behavior - Males 18+ that ever had anal sex with a woman (%)
Sexual Behavior - Males 18+ that ever had any sex with a man (%)
Sexual Behavior - Females 18+ that ever had vaginal sex with a man (%)
Sexual Behavior - Females 18+ that ever performed oral sex on a man (%)
Sexual Behavior - Females 18+ that ever had anal sex with a man (%)
Sexual Behavior - Females 18+ that ever had any kind of sex with a woman (%)
Sexual Behavior - Average age people first had sex
Sexual Behavior - Average number of female sex partners in lifetime (males 18+)
Sexual Behavior - Average number of female vaginal sex partners in lifetime (males 18+)
Sexual Behavior - Average age people first performed oral sex on a woman (18+)
Sexual Behavior - Average number of woman performed oral sex on in lifetime (18+)
Sexual Behavior - Average number of male sex partners in lifetime (males 18+)
Sexual Behavior - Average number of male anal sex partners in lifetime (males 18+)
Sexual Behavior - Average age people first performed oral sex on a man (18+)
Sexual Behavior - Average number of male oral sex partners in lifetime (18+)
Sexual Behavior - People using protection when performing oral sex (%)
Sexual Behavior - Average number of times people have vaginal or anal sex a year
Sexual Behavior - People having sex without condom (%)
Sexual Behavior - Average number of male sex partners in lifetime (females 18+)
Sexual Behavior - Average number of male vaginal sex partners in lifetime (females 18+)
Sexual Behavior - Average number of female sex partners in lifetime (females 18+)
Sexual Behavior - Circumcised males 18+ (%)
Sleep Disorders - Average hours sleeping at night
Sleep Disorders - People that has trouble sleeping (%)
Smoking-Cigarette Use - People smoking cigarettes (%)
Taste & Smell - People 40+ having problems with smell (%)
Taste & Smell - People 40+ having problems with taste (%)
Taste & Smell - People 40+ that ever had wisdom teeth removed (%)
Taste & Smell - People 40+ that ever had tonsils teeth removed (%)
Taste & Smell - People 40+ that ever had a loss of consciousness because of a head injury (%)
Taste & Smell - People 40+ that ever had a broken nose or other serious injury to face or skull (%)
Taste & Smell - People 40+ that ever had two or more sinus infections (%)
Weight - Average height (inches)
Weight - Average weight (pounds)
Weight - Average BMI
Weight - People that are obese (%)
Weight - People that ever were obese (%)
Weight - People trying to lose weight (%)
Urban population: 11,640
Rural population: 4,692
Estimated median house/condo value in 2022: $219,499
46113:
$219,499Indiana:
$208,700
According to our research of Indiana and other state lists, there was 1 registered sex offender living in 46113 zip code as of May 15, 2024 . The ratio of all residents to sex offenders in zip code 46113 is 15,926 to 1.The ratio of registered sex offenders to all residents in this zip code is much lower than the state average.
Median resident age: This zip code:
37.1 yearsIndiana median age:
38.2 years
Average household size: This zip code:
2.6 peopleIndiana:
2.4 people
Averages for the 2020 tax year for zip code 46113, filed in 2021:
Average Adjusted Gross Income (AGI) in 2020: $56,218 (Individual Income Tax Returns) Here:
$56,218State:
$64,978
Salary/wage: $51,214 (reported on 88.0% of returns )Here:
$51,214State:
$55,245
(% of AGI for various income ranges: 1106.6% for AGIs below $25k , 3670.7% for AGIs $25k-50k , 6834.7% for AGIs $50k-75k , 9224.2% for AGIs $75k-100k , 17174.4% for AGIs $100k-200k , 43230.0% for AGIs over 200k ) Taxable interest for individuals: $787 (reported on 16.1% of returns )This zip code:
$787Indiana:
$1,351
(% of AGI for various income ranges: 6.7% for AGIs below $25k , 7.9% for AGIs $25k-50k , 8.9% for AGIs $50k-75k , 13.6% for AGIs $75k-100k , 54.8% for AGIs $100k-200k , 470.0% for AGIs over 200k ) Ordinary dividends: $2,102 (reported on 8.1% of returns )(% of AGI for various income ranges: 7.3% for AGIs below $25k , 11.2% for AGIs $25k-50k , 16.2% for AGIs $50k-75k , 21.2% for AGIs $75k-100k , 66.4% for AGIs $100k-200k , 612.5% for AGIs over 200k ) Net capital gain/loss in AGI: +$8,013 (reported on 7.8% of returns )Here:
+$8,013State:
+$17,730
(% of AGI for various income ranges: 8.0% for AGIs below $25k , 11.5% for AGIs $25k-50k , 32.3% for AGIs $50k-75k , 94.9% for AGIs $75k-100k , 269.7% for AGIs $100k-200k , 4625.0% for AGIs over 200k ) Profit/loss from business: +$7,665 (reported on 12.9% of returns )Here:
+$7,665State:
+$12,144
(% of AGI for various income ranges: 69.8% for AGIs below $25k , 67.7% for AGIs $25k-50k , 139.0% for AGIs $50k-75k , 182.6% for AGIs $75k-100k , 284.4% for AGIs $100k-200k , 1550.0% for AGIs over 200k ) Taxable individual retirement arrangement distribution: $16,398 (reported on 6.1% of returns )46113:
$16,398Indiana:
$18,302
(% of AGI for various income ranges: 34.3% for AGIs below $25k , 65.2% for AGIs $25k-50k , 84.2% for AGIs $50k-75k , 256.3% for AGIs $75k-100k , 509.2% for AGIs $100k-200k ) Total itemized deductions: $32,446 (reported on 4.6% of returns )Here:
$32,446State:
$35,601
(% of AGI for various income ranges: 119.9% for AGIs $25k-50k , 271.1% for AGIs $50k-75k , 345.1% for AGIs $75k-100k , 485.9% for AGIs $100k-200k , 2627.5% for AGIs over 200k ) Charity contributions: $12,223 (reported on 3.7% of returns )Here:
$12,223State:
$15,596
(% of AGI for various income ranges: 30.8% for AGIs $25k-50k , 93.7% for AGIs $50k-75k , 99.5% for AGIs $75k-100k , 151.7% for AGIs $100k-200k , 827.5% for AGIs over 200k ) Taxes paid: $6,130 (reported on 4.6% of returns )(% of AGI for various income ranges: 12.8% for AGIs $25k-50k , 44.1% for AGIs $50k-75k , 60.8% for AGIs $75k-100k , 121.5% for AGIs $100k-200k , 737.5% for AGIs over 200k ) Earned income credit: $2,278 (reported on 16.1% of returns )(% of AGI for various income ranges: 86.3% for AGIs below $25k , 69.1% for AGIs $25k-50k , 1.4% for AGIs $50k-75k ) Percentage of individuals using paid preparers for their 2020 taxes: 94.0%(% for various income ranges: 93.4% for AGIs below $25k , 94.5% for AGIs $25k-50k , 95.0% for AGIs $50k-75k , 94.6% for AGIs $75k-100k , 93.3% for AGIs $100k-200k , 90.0% for AGIs over 200k )
Averages for the 2012 tax year for zip code 46113, filed in 2013:
Average Adjusted Gross Income (AGI) in 2012: $48,860 (Individual Income Tax Returns) Here:
$48,860State:
$52,932
Salary/wage: $45,535 (reported on 89.5% of returns )Here:
$45,535State:
$45,173
(% of AGI for various income ranges: 75.9% for AGIs below $25k , 87.3% for AGIs $25k-50k , 86.7% for AGIs $50k-75k , 86.2% for AGIs $75k-100k , 82.3% for AGIs $100k-200k , 58.1% for AGIs over 200k ) Taxable interest for individuals: $766 (reported on 21.0% of returns )This zip code:
$766Indiana:
$1,311
(% of AGI for various income ranges: 0.7% for AGIs below $25k , 0.2% for AGIs $25k-50k , 0.2% for AGIs $50k-75k , 0.3% for AGIs $75k-100k , 0.2% for AGIs $100k-200k , 1.5% for AGIs over 200k ) Ordinary dividends: $1,688 (reported on 9.8% of returns )(% of AGI for various income ranges: 0.6% for AGIs below $25k , 0.2% for AGIs $25k-50k , 0.2% for AGIs $50k-75k , 0.2% for AGIs $75k-100k , 0.3% for AGIs $100k-200k , 1.8% for AGIs over 200k ) Net capital gain/loss in AGI: +$2,957 (reported on 7.2% of returns )Here:
+$2,957State:
+$10,406
(% of AGI for various income ranges: 0.6% for AGIs $75k-100k , 0.7% for AGIs $100k-200k , 2.6% for AGIs over 200k ) Profit/loss from business: +$9,178 (reported on 11.7% of returns )Here:
+$9,178State:
+$11,105
(% of AGI for various income ranges: 5.5% for AGIs below $25k , 2.0% for AGIs $25k-50k , 1.3% for AGIs $50k-75k , 1.8% for AGIs $75k-100k , 2.9% for AGIs $100k-200k ) Taxable individual retirement arrangement distribution: $12,751 (reported on 6.9% of returns )46113:
$12,751Indiana:
$13,841
(% of AGI for various income ranges: 2.2% for AGIs below $25k , 1.4% for AGIs $25k-50k , 1.5% for AGIs $50k-75k , 1.9% for AGIs $75k-100k , 2.5% for AGIs $100k-200k ) Total itemized deductions: $16,887 (21% of AGI, reported on 32.0% of returns )Here:
$16,887State:
$20,913
Here:
20.8% of AGIState:
18.2% of AGI
(% of AGI for various income ranges: 5.9% for AGIs below $25k , 8.6% for AGIs $25k-50k , 10.4% for AGIs $50k-75k , 13.3% for AGIs $75k-100k , 13.4% for AGIs $100k-200k , 12.5% for AGIs over 200k ) Charity contributions: $3,186 (reported on 23.5% of returns )(% of AGI for various income ranges: 0.5% for AGIs below $25k , 1.0% for AGIs $25k-50k , 1.2% for AGIs $50k-75k , 1.6% for AGIs $75k-100k , 2.1% for AGIs $100k-200k , 4.0% for AGIs over 200k ) Taxes paid: $5,866 (reported on 32.0% of returns )(% of AGI for various income ranges: 0.9% for AGIs below $25k , 2.1% for AGIs $25k-50k , 3.1% for AGIs $50k-75k , 4.9% for AGIs $75k-100k , 5.7% for AGIs $100k-200k , 5.9% for AGIs over 200k ) Earned income credit: $2,203 (reported on 17.5% of returns )(% of AGI for various income ranges: 6.5% for AGIs below $25k , 1.2% for AGIs $25k-50k ) Percentage of individuals using paid preparers for their 2012 taxes: 42.2%(% for various income ranges: 40.6% for AGIs below $25k , 38.4% for AGIs $25k-50k , 42.0% for AGIs $50k-75k , 45.9% for AGIs $75k-100k , 52.5% for AGIs $100k-200k , 66.7% for AGIs over 200k )
Averages for the 2004 tax year for zip code 46113, filed in 2005:
Average Adjusted Gross Income (AGI) in 2004: $45,703 (Individual Income Tax Returns) Here:
$45,703State:
$44,790
Salary/wage: $43,618 (reported on 90.6% of returns )Here:
$43,618State:
$39,615
(% of AGI for various income ranges: 99.4% for AGIs below $10k , 78.9% for AGIs $10k-25k , 87.0% for AGIs $25k-50k , 89.9% for AGIs $50k-75k , 91.4% for AGIs $75k-100k , 78.3% for AGIs over 100k ) Taxable interest for individuals: $1,058 (reported on 34.8% of returns )This zip code:
$1,058Indiana:
$1,535
(% of AGI for various income ranges: 3.8% for AGIs below $10k , 1.4% for AGIs $10k-25k , 0.8% for AGIs $25k-50k , 0.4% for AGIs $50k-75k , 0.6% for AGIs $75k-100k , 1.1% for AGIs over 100k ) Taxable dividends: $1,459 (reported on 14.1% of returns )(% of AGI for various income ranges: 1.3% for AGIs below $10k , 0.5% for AGIs $10k-25k , 0.3% for AGIs $25k-50k , 0.2% for AGIs $50k-75k , 0.2% for AGIs $75k-100k , 1.2% for AGIs over 100k ) Net capital gain/loss: +$7,563 (reported on 10.5% of returns )Here:
+$7,563State:
+$8,619
(% of AGI for various income ranges: -0.2% for AGIs below $10k , 0.1% for AGIs $10k-25k , 0.2% for AGIs $25k-50k , 0.4% for AGIs $50k-75k , 0.6% for AGIs $75k-100k , 6.9% for AGIs over 100k ) Profit/loss from business: +$8,049 (reported on 13.7% of returns )Here:
+$8,049State:
+$10,071
(% of AGI for various income ranges: 12.4% for AGIs below $10k , 4.8% for AGIs $10k-25k , 3.1% for AGIs $25k-50k , 1.7% for AGIs $50k-75k , 0.9% for AGIs $75k-100k , 2.6% for AGIs over 100k ) IRA payment deduction: $2,211 (reported on 1.7% of returns )46113:
$2,211Indiana:
$2,840
(% of AGI for various income ranges: 0.1% for AGIs $10k-25k , 0.1% for AGIs $25k-50k , 0.1% for AGIs $50k-75k , 0.2% for AGIs $75k-100k ) Total itemized deductions: $14,994 (22% of AGI, reported on 42.6% of returns )Here:
$14,994State:
$17,065
Here:
21.6% of AGIState:
19.5% of AGI
(% of AGI for various income ranges: 9.1% for AGIs below $10k , 8.7% for AGIs $10k-25k , 12.5% for AGIs $25k-50k , 14.3% for AGIs $50k-75k , 16.0% for AGIs $75k-100k , 15.2% for AGIs over 100k ) Charity contributions deductions: $2,354 (3% of AGI, reported on 34.3% of returns )Here:
3.2% of AGIState:
3.8% of AGI
(% of AGI for various income ranges: 0.9% for AGIs below $10k , 0.7% for AGIs $10k-25k , 1.2% for AGIs $25k-50k , 1.7% for AGIs $50k-75k , 2.0% for AGIs $75k-100k , 2.6% for AGIs over 100k ) Total tax: $5,212 (reported on 80.0% of returns )(% of AGI for various income ranges: 3.5% for AGIs below $10k , 4.4% for AGIs $10k-25k , 6.5% for AGIs $25k-50k , 8.0% for AGIs $50k-75k , 9.8% for AGIs $75k-100k , 14.8% for AGIs over 100k ) Earned income credit: $1,695 (reported on 12.4% of returns )Percentage of individuals using paid preparers for their 2004 taxes: 51.9%(% for various income ranges: 43.9% for AGIs below $10k , 55.1% for AGIs $10k-25k , 53.7% for AGIs $25k-50k , 52.7% for AGIs $50k-75k , 50.0% for AGIs $75k-100k , 54.1% for AGIs over 100k )
Estimated median household income in 2022: This zip code:
$85,908Indiana:
$66,785
Nearest zip codes: 46183 ,
46231 ,
46221 ,
46158 ,
46241 ,
46168 .
Mooresville Zip Code Map
Percentage of family households: This zip code:
53.2%Indiana:
46.2%
Percentage of households with unmarried partners: This zip code:
6.5%Indiana:
48.0%
Likely homosexual households (counted as self-reported same-sex unmarried-partner households)
Lesbian couples: 0.4% of all households Gay men: 0.0% of all households
Household received Food Stamps/SNAP in the past 12 months: 493Household did not receive Food Stamps/SNAP in the past 12 months: 5,784
Women who had a birth in the past 12 months: 259 (210 now married , 54 unmarried) Women who did not have a birth in the past 12 months: 3,738 (2,137 now married , 1,610 unmarried)
Housing units in zip code 46113 with a mortgage: 3,886 (180
second mortgage , 159
both second mortgage and home equity loan )
Houses without a mortgage: 13
Median monthly owner costs for units with a mortgage: $1,333
Median monthly owner costs for units without a mortgage: $475
Residents with income below the poverty level in 2022:
This zip code:
9.1%Whole state:
12.6%
Residents with income below 50% of the poverty level in 2022:
This zip code:
5.9%Whole state:
6.3%
Median number of rooms in houses and condos: Median number of rooms in apartments: Notable locations in this zip code not listed on our city pages
Click to draw/clear zip code borders Notable locations in zip code 46113: (A) , Heartland Crossing Business Park (B) , Friendswood Golf Course (C) , Nazarene Church Camp (D) , Decatur Township Fire Station 773 (E) , Madison Township Fire Department Station 32 Headquarters (F) . Display/hide their locations on the map
Churches in zip code 46113 include: (A) , Friendswood Baptist Church (B) , Bethel Chapel (C) , North Madison Southern Baptist Church (D) , Fairfield Church (E) . Display/hide their locations on the map
Cemeteries: (1) , Fairfield Friends Cemetery (2) , Lick Branch Cemetery (3) , Silon Cemetery (4) . Display/hide their locations on the map
Reservoirs: (A) , Walnut Grove Lake (B) , Upper Spring Lake (C) , Upper Wildwood Lake (D) , Leona Lake (E) , Lambert Lake (F) . Display/hide their locations on the map
Streams, rivers, and creeks: (A) , Leg Creek (B) , Penns Run (C) , Trotter Creek (D) , Paddock Run (E) , Hendricks Creek (F) , Gander Creek (G) , Flynn Creek (H) , Fair Creek (I) . Display/hide their locations on the map
Park in zip code 46113: (1) . Display/hide its location on the map
Year house built (houses)
249 2020 or later963 2010 to 20192,086 2000 to 20091,578 1990 to 1999323 1980 to 1989454 1970 to 1979269 1960 to 1969255 1950 to 1959147 1940 to 1949187 1939 or earlier
Zip code 46113 household income distribution in 2022 167 Less than $10,00093 $10,000 to $14,999134 $15,000 to $19,99993 $20,000 to $24,999312 $25,000 to $29,999102 $30,000 to $34,999354 $35,000 to $39,999214 $40,000 to $44,999193 $45,000 to $49,999224 $50,000 to $59,999617 $60,000 to $74,9991,510 $75,000 to $99,9991,010 $100,000 to $124,999456 $125,000 to $149,999507 $150,000 to $199,999276 $200,000 or moreEstimate of home value of owner-occupied houses/condos in 2022 in zip code 46113 101 Less than $10,00040 $10,000 to $14,99933 $15,000 to $19,99921 $20,000 to $24,99969 $25,000 to $29,9995 $30,000 to $34,99993 $80,000 to $89,999171 $100,000 to $124,999361 $125,000 to $149,9991,087 $150,000 to $174,999426 $175,000 to $199,9991,300 $200,000 to $249,999452 $250,000 to $299,999593 $300,000 to $399,999135 $400,000 to $499,99986 $500,000 to $749,99924 $750,000 to $999,99942 $1,000,000 to $1,499,9997 $1,500,000 to $1,999,99946 $2,000,000 or moreRent paid by renters in 2022 in zip code 46113 12 $300 to $34916 $350 to $39919 $450 to $49959 $500 to $54943 $600 to $64917 $650 to $69950 $750 to $79988 $800 to $89983 $900 to $999367 $1,000 to $1,249278 $1,250 to $1,499252 $1,500 to $1,9999 $2,000 to $2,49931 No cash rent
Median gross rent in 2022: $1,382.
Median price asked for vacant for-sale houses and condos in 2022: $194,967.
Estimated median house (or condo) value in 2022 for: White Non-Hispanic householders: $216,750American Indian or Alaska Native householders: $119,093Asian householders: $206,123Two or more races householders: $343,539Estimated median house or condo value in 2022: $219,499
46113:
$219,499Indiana:
$208,700
Lower value quartile - upper value quartile: $171,765 - $277,103
Mean price in 2022: Detached houses: $268,516Here:
$268,516State:
$257,916
Townhouses or other attached units: $122,307Here:
$122,307State:
$224,114
Mobile homes: $68,495Here:
$68,495State:
$67,116
Housing units in structures:
One, detached: 5,135One, attached: 410Two: 473 or 4: 1815 to 9: 23810 to 19: 18820 to 49: 3950 or more: 38Mobile homes: 130Unemployment : 3.6%
Means of transportation to work in zip code 46113 81.2% 7,067 Drove a car alone9.3% 810 Carpooled0.4% 37 Walked8.2% 718 Worked at homeTravel time to work (commute) in zip code 46113 71 Less than 5 minutes635 5 to 9 minutes923 10 to 14 minutes939 15 to 19 minutes1,083 20 to 24 minutes1,229 25 to 29 minutes1,379 30 to 34 minutes446 35 to 39 minutes246 40 to 44 minutes527 45 to 59 minutes379 60 to 89 minutes77 90 or more minutes
Percentage of zip code residents living and working in this county: 44.2%
Household type by relationship:
Households: 16,333
Male householders: 2,854 (551 living alone ), Female householders: 3,433 (929 living alone )3,372 spouses (3,361 opposite-sex spouses ), 420 unmarried partners , (399 opposite-sex unmarried partners ), 4,852 children (4,581 natural , 86 adopted , 181 stepchildren ), 404 grandchildren , 81 brothers or sisters , 169 parents , 0 foster children , 367 other relatives , 341 non-relatives In group quarters: 36 (-1 institutionalized population )
Size of family households: 1,944 2-persons , 766 3-persons , 931 4-persons , 431 5-persons , 77 6-persons , 195 7-or-more-persons
Size of nonfamily households: 1,481 1-person , 411 2-persons , 11 3-persons , 22 5-persons
2,914 married couples with children. single-parent households (246 men , 549 women ).
91.0% of residents of 46113 zip code speak English at home. of residents speak Spanish at home (71% very well, 16% well, 13% not well ).of residents speak other Indo-European language at home (32% very well, 22% well, 10% not well, 36% not at all ).of residents speak Asian or Pacific Island language at home (100% very well ).of residents speak other language at home (56% very well, 18% well, 26% not well ).
Foreign born population: 1,069 (6.5%)
(47.1%
of them are naturalized citizens )
This zip code:
6.5%Whole state:
6.1%
54% Grenada 46% Liberia 7% Togo 6% Yemen 3% Honduras 3% Poland 3% Bhutan 17% American 15% Haitian 14% African 14% English 11% German 3% Irish 2% Scottish
Year of entry for the foreign-born population
1,011 2010 or later 269 2000 to 2009 137 1990 to 1999 63 Before 1990
Facilities with environmental interests located in this zip code:
NORTH MADISON ELEM SCH (7456 E HADLEY RD in CAMBY, IN)
(National Center for Education Statistics) - STATE ID-6385 Organizations: MOORESVILLE CON SCHOOL CORP (SCHOOL DISTRICT)
MEIJER 204 (10501 HEARTLAND BLVD in CAMBY, IN)
STATE MASTER (Indiana facility tracking) Conditionally Exempt Small Quantity Generators, less than 100 kg/month of hazardous waste (Resource Conservation and Recovery Act (tracking hazardous waste)) - notification Conditionally Exempt Small Quantity Generators, less than 100 kg/month of hazardous waste (Resource Conservation and Recovery Act (tracking hazardous waste)) Organizations: MEIJER LIMITED STORES PARTNESHIP (CONTACT/OPERATOR)
, MEIJER STORES LTD PARTNERSHIP (CONTACT/OWNER)
, MEIJER LIMITED STORES PARTNERSHIP (CONTACT/OWNER)
Alternative names: MEIJER #204
Housing units lacking complete plumbing facilities: 0.5%
Housing units lacking complete kitchen facilities: 1.1%
52.8% Utility gas 41.7% Electricity 4.3% Bottled, tank, or LP gas 0.6% Wood
Population in 1990: 2,681. Population change in the 1990s: +3,985 (+148.6%).
Place of birth for U.S.-born residents:
This state: 11,559Northeast: 254Midwest: 1,322South: 1,405West: 397
51% of the 46113 zip code residents lived in the same house 5 years ago.
Out of people who lived in different houses, 41% lived in this county.
Out of people who lived in different counties, 50% lived in Indiana.
86% of the 46113 zip code residents lived in the same house 1 year ago.
Out of people who lived in different houses, 21% moved from this county.
Out of people who lived in different houses, 63% moved from different county within same state.
Out of people who lived in different houses, 15% moved from different state.
Out of people who lived in different houses, 1% moved from abroad.
Private vs. public school enrollment:
Students in private schools in grades 1 to 8 (elementary and middle school): 104
Students in private schools in grades 9 to 12 (high school): 161
Students in private undergraduate colleges: 162
Occupation by median earnings in the past 12 months ($)
98,727 Health technologists and technicians 86,869 Health diagnosing and treating practitioners and other technical occupations 77,628 Life, physical, and social science occupations 76,413 Architecture and engineering occupations 74,942 Computer and mathematical occupations 62,212 Transportation occupations
Companies with federal contracts located in this zip code:
APEX PRECISION TECHNOLOGIES (8824 UNION MILLS DR in CAMBY, IN; small business) employees , $0 revenue . : $416,547 in 8 contracts from 2000 to 2004
Contracts for Gas Turbines and Jet Engines, Aircraft; Prime Moving, and Components, Miscellaneous Power Transmission Equipment, Nails, Machine Keys, and Pins by Defense Logistics AgencySigned by year: 2000: $62,616; 2001: $107,598; 2002: $36,335; 2003: $0; 2004: $209,998; 2005: $0; 2006: $0.
Biggest contracts: with Defense Logistics Agency for Gas Turbines and Jet Engines, Aircraft; Prime Moving, and Components. Signed on 2004-12-15. Completion date: 2006-03-28.
, same as above. Signed on 2004-12-15. Completion date: 2006-02-28.
with Defense Logistics Agency for Miscellaneous Power Transmission Equipment. Signed on 2000-07-03. Completion date: 2001-01-10.
with Defense Logistics Agency for Gas Turbines and Jet Engines, Aircraft; Prime Moving, and Components. Signed on 2001-12-13. Completion date: 2002-07-02.
BOBBIE C PERRY (7155 E WISER AVE in CAMBY, IN; small business) in 3 contracts from 2005 to 2006
$24,000 with Navy for Miscellaneous Fabricated Nonmetallic Materials. Signed on 2005-04-21. Completion date: 2005-07-22.
with Army for Coil, Flat, Leaf, and Wire Springs. Signed on 2006-02-16. Completion date: 2006-03-30.
with Navy for Miscellaneous Fabricated Nonmetallic Materials. Signed on 2006-03-21. Completion date: 2006-05-12.
WAX SHIELD INC (11818 N BENS CT in CAMBY, IN; small business)
$5,298 with Defense Logistics Agency for Miscellaneous Chemical Specialties. Signed on 2005-07-07. Completion date: 2005-08-10.
Top industries in this zip code by the number of employees in 2005:
Accommodation and Food Services: Full-Service Restaurants (50-99 employees: 1 establishment, 20-49 employees: 3 establishments, 10-19 employees: 2 establishments)Construction: Structural Steel and Precast Concrete Contractors (50-99: 1)Accommodation and Food Services: Limited-Service Restaurants (20-49: 1, 1-4: 1)Accommodation and Food Services: Snack and Nonalcoholic Beverage Bars (20-49: 1)Wholesale Trade: Electrical and Electronic Appliance, Television, and Radio Set Merchant Wholesalers (20-49: 1)
People in group quarters in 2010:
6 people in group homes for juveniles (non-correctional)
People in group quarters in 2000:
20 people in homes for the mentally retarded
7 people in college dormitories (includes college quarters off campus)
Fatal accident statistics in 2014:
Fatal accident count: 1Vehicles involved in fatal accidents: 1Fatal accidents caused by drunken drivers: 0Fatalities: 1Persons involved in fatal accidents: 1Pedestrians involved in fatal accidents: 1
Fatal accident statistics in 2012:
Fatal accident count: 1Vehicles involved in fatal accidents: 1Fatal accidents caused by drunken drivers: 0Fatalities: 1Persons involved in fatal accidents: 1Pedestrians involved in fatal accidents: 1
Home Mortgage Disclosure Act Aggregated Statistics For Year 2009(Based on 4 partial tracts) A) FHA, FSA/RHS & VA B) Conventional C) Refinancings D) Home Improvement Loans E) Loans on Dwellings For 5+ Families F) Non-occupant Loans on G) Loans On Manufactured Number Average Value Number Average Value Number Average Value Number Average Value Number Average Value Number Average Value Number Average Value
LOANS ORIGINATED 217 $105,757 70 $103,224 468 $125,133 17 $56,025 1 $10,097,610 23 $68,251 1 $71,840 APPLICATIONS APPROVED, NOT ACCEPTED 8 $125,326 1 $123,830 45 $124,658 5 $24,876 0 $0 0 $0 0 $0 APPLICATIONS DENIED 32 $100,942 20 $93,037 220 $134,236 13 $54,765 0 $0 10 $87,353 4 $37,068 APPLICATIONS WITHDRAWN 29 $103,107 6 $98,023 148 $127,304 6 $151,838 0 $0 7 $101,786 1 $89,030 FILES CLOSED FOR INCOMPLETENESS 8 $101,300 0 $0 24 $132,709 1 $65,610 0 $0 1 $48,510 0 $0
Aggregated Statistics For Year 2008(Based on 4 partial tracts) A) FHA, FSA/RHS & VA B) Conventional C) Refinancings D) Home Improvement Loans E) Loans on Dwellings For 5+ Families F) Non-occupant Loans on G) Loans On Manufactured Number Average Value Number Average Value Number Average Value Number Average Value Number Average Value Number Average Value Number Average Value
LOANS ORIGINATED 232 $111,752 114 $107,961 241 $125,523 28 $35,910 1 $8,039,150 41 $88,725 1 $12,280 APPLICATIONS APPROVED, NOT ACCEPTED 13 $110,653 12 $111,503 36 $116,016 6 $43,392 0 $0 4 $94,680 1 $13,510 APPLICATIONS DENIED 59 $109,938 26 $91,233 270 $126,661 65 $41,546 0 $0 18 $83,508 6 $43,033 APPLICATIONS WITHDRAWN 24 $107,342 15 $160,243 116 $124,549 7 $106,873 0 $0 10 $79,064 0 $0 FILES CLOSED FOR INCOMPLETENESS 11 $117,828 3 $136,707 27 $131,710 1 $87,960 0 $0 0 $0 0 $0
Aggregated Statistics For Year 2007(Based on 4 partial tracts) A) FHA, FSA/RHS & VA B) Conventional C) Refinancings D) Home Improvement Loans F) Non-occupant Loans on G) Loans On Manufactured Number Average Value Number Average Value Number Average Value Number Average Value Number Average Value Number Average Value
LOANS ORIGINATED 122 $119,417 327 $105,880 295 $111,327 35 $39,361 62 $79,738 6 $51,985 APPLICATIONS APPROVED, NOT ACCEPTED 12 $115,647 28 $101,829 70 $117,240 12 $35,826 7 $89,501 1 $35,610 APPLICATIONS DENIED 24 $118,691 68 $108,853 371 $125,309 79 $39,757 22 $103,247 9 $49,460 APPLICATIONS WITHDRAWN 25 $118,754 37 $100,285 142 $124,032 16 $59,902 13 $105,528 0 $0 FILES CLOSED FOR INCOMPLETENESS 2 $113,920 10 $87,812 40 $137,384 0 $0 1 $119,990 0 $0
Aggregated Statistics For Year 2006(Based on 4 partial tracts) A) FHA, FSA/RHS & VA B) Conventional C) Refinancings D) Home Improvement Loans F) Non-occupant Loans on G) Loans On Manufactured Number Average Value Number Average Value Number Average Value Number Average Value Number Average Value Number Average Value
LOANS ORIGINATED 139 $120,445 425 $97,703 310 $109,343 48 $33,603 69 $80,906 3 $63,857 APPLICATIONS APPROVED, NOT ACCEPTED 8 $129,279 42 $85,909 77 $98,903 12 $45,773 6 $73,585 2 $50,350 APPLICATIONS DENIED 19 $123,031 107 $97,749 363 $118,617 98 $46,796 24 $75,877 6 $75,250 APPLICATIONS WITHDRAWN 30 $126,727 60 $110,255 202 $114,327 14 $94,724 12 $95,148 0 $0 FILES CLOSED FOR INCOMPLETENESS 1 $161,480 16 $99,144 55 $129,043 1 $61,280 1 $92,100 0 $0
Aggregated Statistics For Year 2005(Based on 4 partial tracts) A) FHA, FSA/RHS & VA B) Conventional C) Refinancings D) Home Improvement Loans F) Non-occupant Loans on G) Loans On Manufactured Number Average Value Number Average Value Number Average Value Number Average Value Number Average Value Number Average Value
LOANS ORIGINATED 160 $117,341 394 $93,135 456 $110,185 56 $46,997 45 $85,830 5 $64,434 APPLICATIONS APPROVED, NOT ACCEPTED 15 $131,414 47 $97,024 83 $108,003 13 $65,402 2 $98,785 0 $0 APPLICATIONS DENIED 36 $128,443 108 $87,559 427 $121,152 95 $38,282 19 $79,115 5 $64,876 APPLICATIONS WITHDRAWN 18 $125,342 46 $91,698 221 $121,228 25 $109,183 15 $86,164 1 $76,140 FILES CLOSED FOR INCOMPLETENESS 5 $115,628 26 $95,921 104 $127,839 5 $48,774 2 $158,245 0 $0
Aggregated Statistics For Year 2004(Based on 4 partial tracts) A) FHA, FSA/RHS & VA B) Conventional C) Refinancings D) Home Improvement Loans F) Non-occupant Loans on G) Loans On Manufactured Number Average Value Number Average Value Number Average Value Number Average Value Number Average Value Number Average Value
LOANS ORIGINATED 235 $116,522 285 $104,911 499 $105,792 47 $28,454 48 $88,333 2 $58,945 APPLICATIONS APPROVED, NOT ACCEPTED 22 $122,655 30 $99,996 94 $115,354 10 $41,537 7 $116,370 2 $36,410 APPLICATIONS DENIED 39 $117,137 58 $83,511 400 $116,351 74 $32,032 13 $109,054 5 $46,784 APPLICATIONS WITHDRAWN 21 $128,542 32 $114,438 180 $116,081 11 $39,715 6 $129,240 1 $10,440 FILES CLOSED FOR INCOMPLETENESS 4 $121,302 11 $94,554 83 $124,989 5 $62,524 4 $119,570 0 $0
Aggregated Statistics For Year 2003(Based on 4 partial tracts) A) FHA, FSA/RHS & VA B) Conventional C) Refinancings D) Home Improvement Loans E) Loans on Dwellings For 5+ Families F) Non-occupant Loans on Number Average Value Number Average Value Number Average Value Number Average Value Number Average Value Number Average Value
LOANS ORIGINATED 276 $117,501 227 $108,263 1,012 $110,216 34 $29,764 1 $6,637,530 44 $82,703 APPLICATIONS APPROVED, NOT ACCEPTED 12 $109,048 22 $99,424 131 $107,027 9 $16,283 0 $0 3 $68,870 APPLICATIONS DENIED 33 $115,320 42 $81,902 392 $96,302 35 $15,849 0 $0 17 $65,802 APPLICATIONS WITHDRAWN 18 $131,093 15 $118,449 192 $115,026 6 $11,568 0 $0 2 $57,760 FILES CLOSED FOR INCOMPLETENESS 4 $110,762 13 $102,306 47 $105,989 1 $9,210 0 $0 1 $62,010
Aggregated Statistics For Year 2002(Based on 4 partial tracts) A) FHA, FSA/RHS & VA B) Conventional C) Refinancings D) Home Improvement Loans F) Non-occupant Loans on Number Average Value Number Average Value Number Average Value Number Average Value Number Average Value
LOANS ORIGINATED 248 $115,317 159 $110,383 714 $104,767 32 $21,889 32 $89,508 APPLICATIONS APPROVED, NOT ACCEPTED 15 $132,317 16 $111,032 113 $102,176 7 $12,434 2 $131,405 APPLICATIONS DENIED 37 $122,129 22 $75,017 299 $96,037 35 $11,263 6 $37,105 APPLICATIONS WITHDRAWN 28 $126,470 10 $100,601 140 $113,697 4 $29,532 3 $76,210 FILES CLOSED FOR INCOMPLETENESS 7 $97,866 2 $97,335 72 $107,094 3 $16,243 1 $47,280
Aggregated Statistics For Year 2001(Based on 4 partial tracts) A) FHA, FSA/RHS & VA B) Conventional C) Refinancings D) Home Improvement Loans F) Non-occupant Loans on Number Average Value Number Average Value Number Average Value Number Average Value Number Average Value
LOANS ORIGINATED 372 $111,064 133 $106,788 614 $99,910 53 $20,525 15 $104,009 APPLICATIONS APPROVED, NOT ACCEPTED 27 $127,869 22 $95,155 98 $85,313 16 $20,161 3 $110,623 APPLICATIONS DENIED 23 $122,284 41 $72,048 296 $76,412 58 $15,750 6 $36,655 APPLICATIONS WITHDRAWN 23 $118,157 8 $114,730 114 $98,939 13 $15,461 1 $122,800 FILES CLOSED FOR INCOMPLETENESS 4 $128,940 7 $131,906 45 $100,349 1 $27,230 1 $46,140
Aggregated Statistics For Year 2000(Based on 4 partial tracts) A) FHA, FSA/RHS & VA B) Conventional C) Refinancings D) Home Improvement Loans F) Non-occupant Loans on Number Average Value Number Average Value Number Average Value Number Average Value Number Average Value
LOANS ORIGINATED 283 $108,303 147 $99,778 230 $73,905 64 $25,411 13 $80,682 APPLICATIONS APPROVED, NOT ACCEPTED 10 $117,834 18 $73,834 60 $72,241 27 $23,190 4 $37,382 APPLICATIONS DENIED 17 $123,449 42 $44,527 178 $66,429 51 $18,944 5 $60,908 APPLICATIONS WITHDRAWN 11 $101,859 12 $91,754 74 $68,964 7 $32,486 1 $151,420 FILES CLOSED FOR INCOMPLETENESS 3 $85,783 6 $101,288 25 $98,958 1 $111,030 0 $0
Aggregated Statistics For Year 1999(Based on 2 partial tracts) A) FHA, FSA/RHS & VA B) Conventional C) Refinancings D) Home Improvement Loans F) Non-occupant Loans on Number Average Value Number Average Value Number Average Value Number Average Value Number Average Value
LOANS ORIGINATED 140 $102,535 78 $103,479 164 $82,138 29 $21,353 4 $57,878 APPLICATIONS APPROVED, NOT ACCEPTED 3 $96,143 9 $86,916 47 $79,040 10 $16,675 1 $26,000 APPLICATIONS DENIED 4 $101,430 24 $55,581 89 $74,684 30 $18,110 1 $114,560 APPLICATIONS WITHDRAWN 10 $109,042 13 $94,662 65 $76,798 4 $66,592 1 $60,950 FILES CLOSED FOR INCOMPLETENESS 1 $117,620 2 $98,410 15 $83,269 0 $0 0 $0
Detailed HMDA statistics for the following Tracts:
3703.00
,
5101.00
Private Mortgage Insurance Companies Aggregated Statistics For Year 2009(Based on 4 partial tracts) A) Conventional B) Refinancings C) Non-occupant Loans on Number Average Value Number Average Value Number Average Value
LOANS ORIGINATED 15 $131,677 16 $135,383 0 $0 APPLICATIONS APPROVED, NOT ACCEPTED 3 $131,377 10 $143,088 0 $0 APPLICATIONS DENIED 6 $114,347 10 $161,313 0 $0 APPLICATIONS WITHDRAWN 0 $0 2 $160,105 0 $0 FILES CLOSED FOR INCOMPLETENESS 1 $42,540 0 $0 1 $42,540
Aggregated Statistics For Year 2008(Based on 4 partial tracts) A) Conventional B) Refinancings C) Non-occupant Loans on Number Average Value Number Average Value Number Average Value
LOANS ORIGINATED 65 $117,813 36 $155,598 14 $83,404 APPLICATIONS APPROVED, NOT ACCEPTED 21 $123,001 22 $152,897 5 $92,280 APPLICATIONS DENIED 7 $89,470 3 $89,163 4 $69,395 APPLICATIONS WITHDRAWN 4 $120,228 3 $76,007 2 $100,105 FILES CLOSED FOR INCOMPLETENESS 6 $104,338 1 $218,580 3 $132,013
Aggregated Statistics For Year 2007(Based on 4 partial tracts) A) Conventional B) Refinancings C) Non-occupant Loans on D) Loans On Manufactured Number Average Value Number Average Value Number Average Value Number Average Value
LOANS ORIGINATED 178 $117,472 54 $126,946 20 $95,656 1 $41,140 APPLICATIONS APPROVED, NOT ACCEPTED 14 $138,859 15 $128,645 1 $55,520 0 $0 APPLICATIONS DENIED 4 $106,168 3 $233,907 1 $232,090 0 $0 APPLICATIONS WITHDRAWN 9 $106,524 5 $127,036 1 $59,840 0 $0 FILES CLOSED FOR INCOMPLETENESS 0 $0 1 $79,310 0 $0 0 $0
Aggregated Statistics For Year 2006(Based on 4 partial tracts) A) Conventional B) Refinancings C) Non-occupant Loans on D) Loans On Manufactured Number Average Value Number Average Value Number Average Value Number Average Value
LOANS ORIGINATED 106 $117,686 27 $148,676 10 $94,268 1 $89,030 APPLICATIONS APPROVED, NOT ACCEPTED 10 $110,513 9 $148,910 2 $107,430 1 $58,330 APPLICATIONS DENIED 1 $143,300 0 $0 0 $0 0 $0 APPLICATIONS WITHDRAWN 3 $138,083 5 $120,056 0 $0 0 $0 FILES CLOSED FOR INCOMPLETENESS 0 $0 0 $0 0 $0 0 $0
Aggregated Statistics For Year 2005(Based on 4 partial tracts) A) Conventional B) Refinancings C) Non-occupant Loans on D) Loans On Manufactured Number Average Value Number Average Value Number Average Value Number Average Value
LOANS ORIGINATED 71 $120,124 43 $131,523 11 $92,921 0 $0 APPLICATIONS APPROVED, NOT ACCEPTED 8 $154,294 12 $146,172 1 $92,290 1 $73,070 APPLICATIONS DENIED 0 $0 1 $210,060 0 $0 0 $0 APPLICATIONS WITHDRAWN 7 $164,687 5 $142,166 2 $115,720 0 $0 FILES CLOSED FOR INCOMPLETENESS 1 $90,130 0 $0 0 $0 0 $0
Aggregated Statistics For Year 2004(Based on 4 partial tracts) A) Conventional B) Refinancings C) Non-occupant Loans on Number Average Value Number Average Value Number Average Value
LOANS ORIGINATED 65 $117,152 54 $115,461 16 $84,234 APPLICATIONS APPROVED, NOT ACCEPTED 10 $114,727 21 $120,177 3 $97,797 APPLICATIONS DENIED 1 $74,910 1 $206,920 1 $128,330 APPLICATIONS WITHDRAWN 4 $126,932 5 $127,200 3 $139,300 FILES CLOSED FOR INCOMPLETENESS 1 $119,610 0 $0 1 $58,330
Aggregated Statistics For Year 2003(Based on 4 partial tracts) A) Conventional B) Refinancings C) Non-occupant Loans on Number Average Value Number Average Value Number Average Value
LOANS ORIGINATED 85 $120,644 140 $119,213 17 $81,306 APPLICATIONS APPROVED, NOT ACCEPTED 9 $133,783 32 $117,152 1 $84,360 APPLICATIONS DENIED 1 $164,550 2 $156,455 0 $0 APPLICATIONS WITHDRAWN 2 $151,970 10 $124,858 0 $0 FILES CLOSED FOR INCOMPLETENESS 0 $0 1 $82,190 0 $0
Aggregated Statistics For Year 2002(Based on 4 partial tracts) A) Conventional B) Refinancings C) Non-occupant Loans on Number Average Value Number Average Value Number Average Value
LOANS ORIGINATED 70 $127,754 100 $121,191 9 $95,070 APPLICATIONS APPROVED, NOT ACCEPTED 5 $138,908 28 $122,995 6 $117,092 APPLICATIONS DENIED 1 $118,680 3 $128,580 1 $42,980 APPLICATIONS WITHDRAWN 2 $179,125 12 $128,451 1 $59,120 FILES CLOSED FOR INCOMPLETENESS 0 $0 1 $72,820 0 $0
Aggregated Statistics For Year 2001(Based on 4 partial tracts) A) Conventional B) Refinancings C) Non-occupant Loans on Number Average Value Number Average Value Number Average Value
LOANS ORIGINATED 50 $122,040 87 $117,147 3 $93,940 APPLICATIONS APPROVED, NOT ACCEPTED 5 $108,360 14 $134,989 1 $25,170 APPLICATIONS DENIED 3 $124,463 3 $127,780 1 $126,180 APPLICATIONS WITHDRAWN 1 $133,380 3 $101,900 0 $0 FILES CLOSED FOR INCOMPLETENESS 0 $0 2 $157,900 0 $0
Aggregated Statistics For Year 2000(Based on 4 partial tracts) A) Conventional B) Refinancings C) Non-occupant Loans on Number Average Value Number Average Value Number Average Value
LOANS ORIGINATED 43 $127,195 13 $107,954 1 $145,640 APPLICATIONS APPROVED, NOT ACCEPTED 5 $118,700 1 $153,120 0 $0 APPLICATIONS DENIED 0 $0 1 $99,500 0 $0 APPLICATIONS WITHDRAWN 1 $105,610 1 $67,770 0 $0 FILES CLOSED FOR INCOMPLETENESS 0 $0 0 $0 0 $0
Aggregated Statistics For Year 1999(Based on 2 partial tracts) A) Conventional B) Refinancings C) Non-occupant Loans on Number Average Value Number Average Value Number Average Value
LOANS ORIGINATED 34 $123,082 20 $101,632 1 $68,040 APPLICATIONS APPROVED, NOT ACCEPTED 1 $117,980 5 $96,018 0 $0 APPLICATIONS DENIED 0 $0 1 $154,540 0 $0 APPLICATIONS WITHDRAWN 0 $0 1 $126,520 0 $0 FILES CLOSED FOR INCOMPLETENESS 0 $0 0 $0 0 $0
Detailed PMIC statistics for the following Tracts:
3703.00
,
5101.00
2002 - 2018 National Fire Incident Reporting System (NFIRS) incidents See full 2006 National Fire Incident Reporting System statistics for zip code 46113, Indiana
Most common first names in zip code 46113 among deceased individuals Name Count Lived (average)
Charles 29 76.1 years Mary 29 74.9 years Robert 28 70.6 years John 26 72.4 years William 25 76.2 years James 21 73.8 years Helen 15 81.7 years George 14 75.3 years Donald 14 71.4 years Paul 11 65.6 years
Most common last names in zip code 46113 among deceased individuals Last name Count Lived (average)
Miller 10 72.3 years Wright 10 74.9 years Smith 10 75.5 years Martin 9 75.7 years Johnson 8 75.6 years Williams 8 78.8 years Jones 6 72.8 years Brown 6 66.3 years Thompson 6 77.0 years White 6 72.3 years
Businesses in zip code 46113
Name Count Name Count
Applebee's 1 Menards 1 Chevrolet 1 Pizza Hut 1 Dunkin Donuts 1 SONIC Drive-In 1 GNC 1 Sprint Nextel 1 GameStop 1 Starbucks 1 H&R Block 1 Subway 2 Lane Furniture 1 Taco Bell 1 Little Caesars Pizza 1 UPS 1 MasterBrand Cabinets 1 Walmart 1 McDonald's 1 White Castle 1 Meijer 1

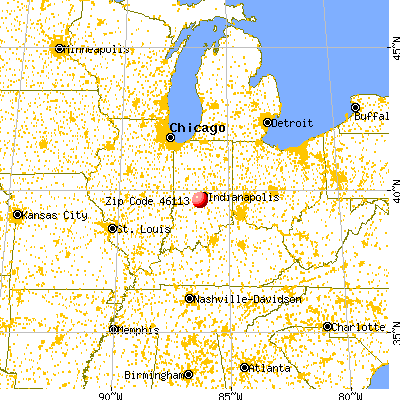


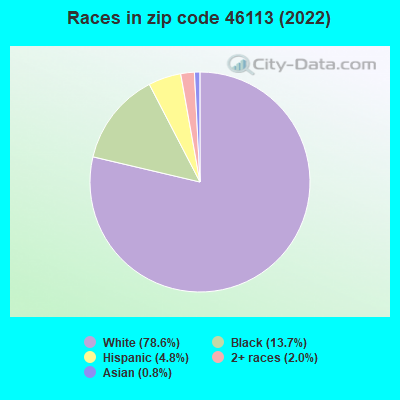


 Nearest zip codes: 46183, 46231, 46221, 46158, 46241, 46168.
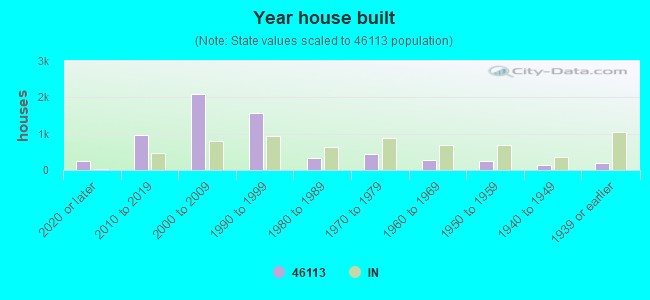

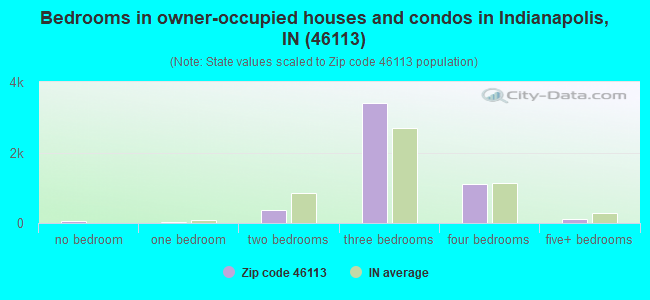
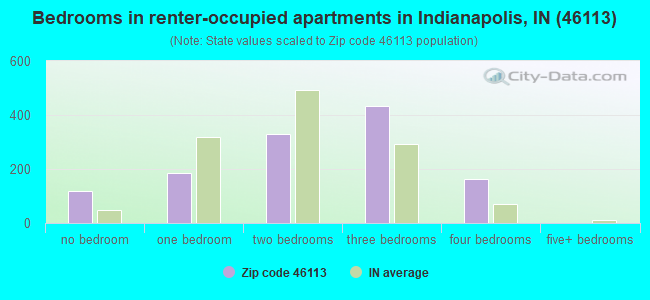
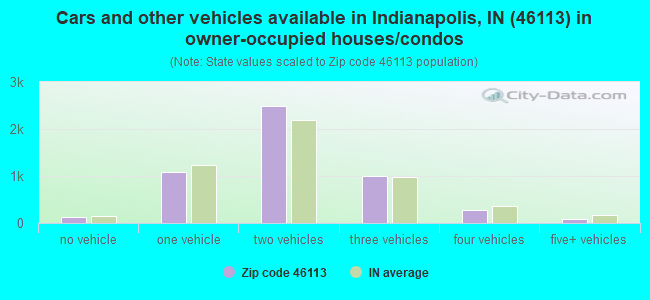
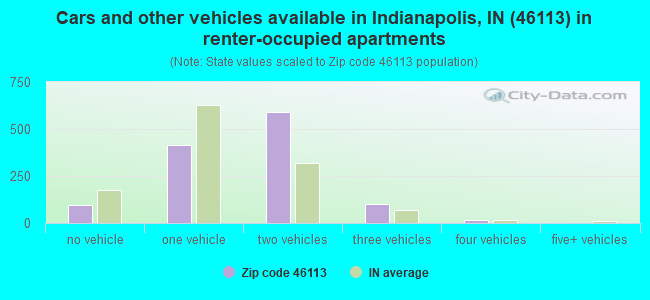


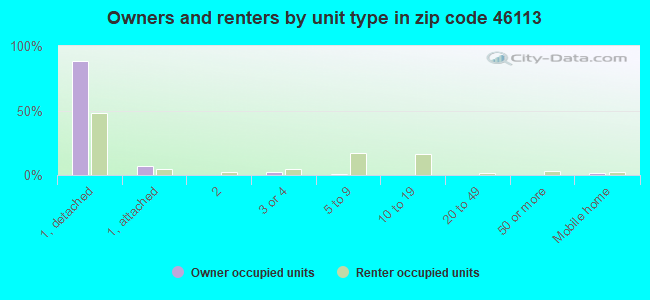
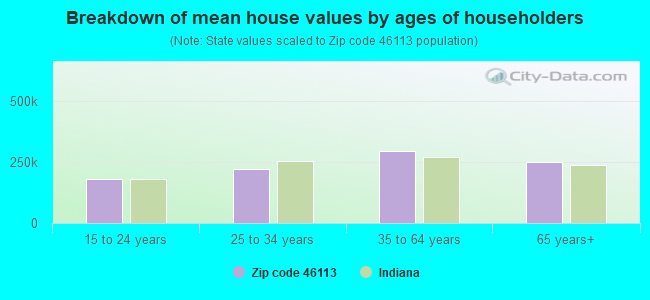


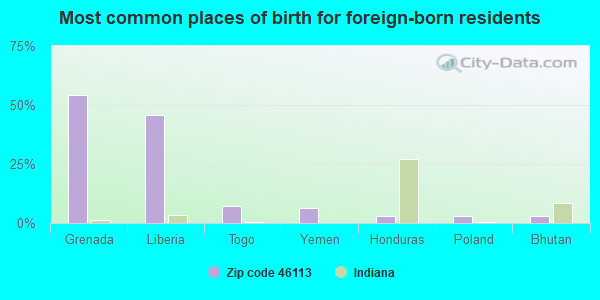
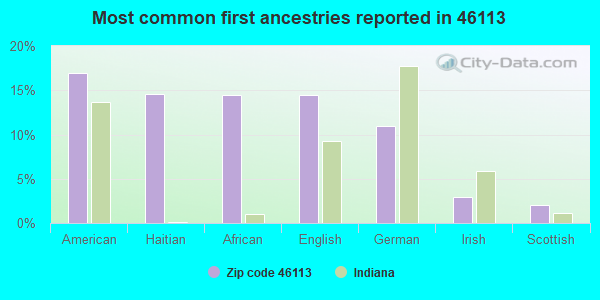
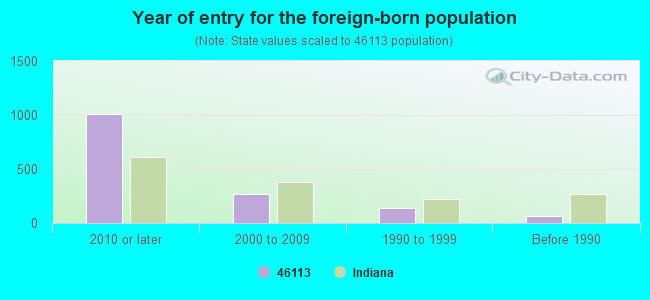


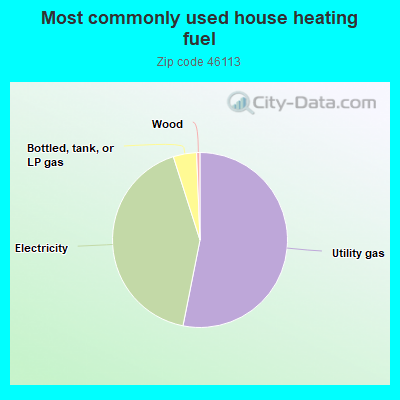
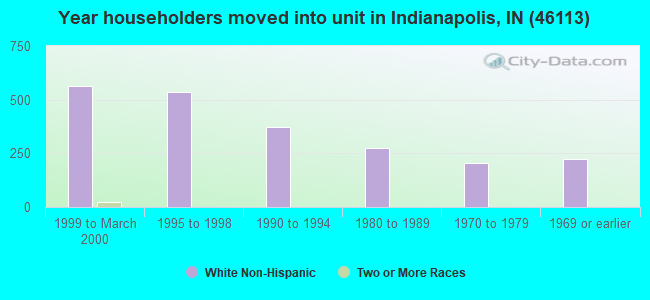
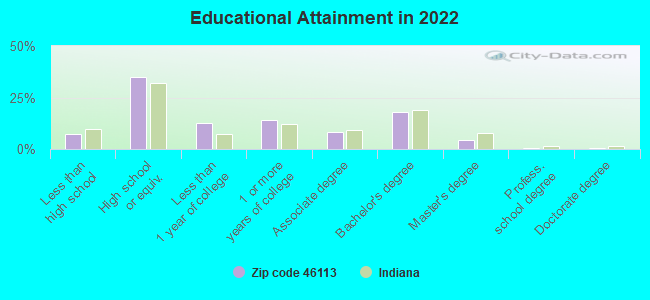
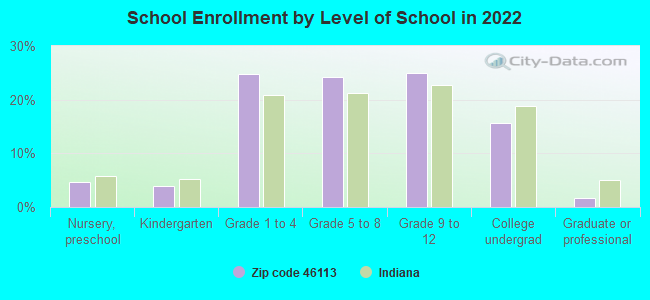
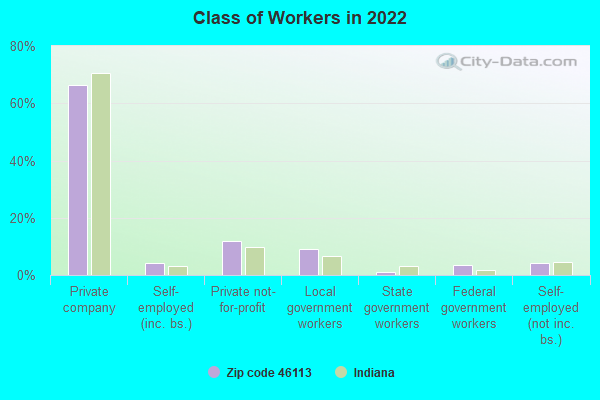
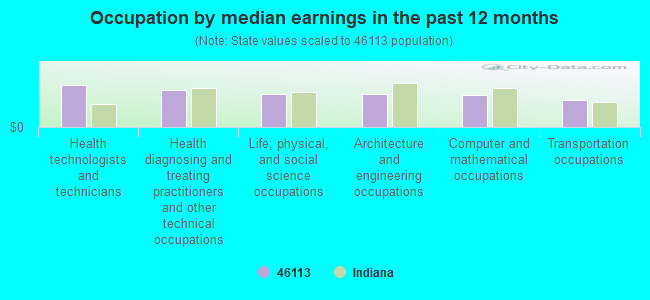
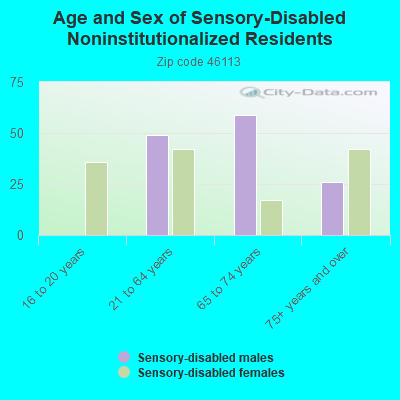
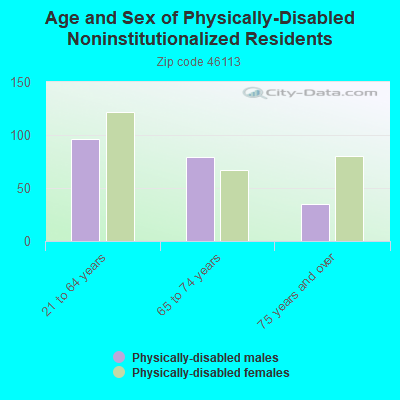
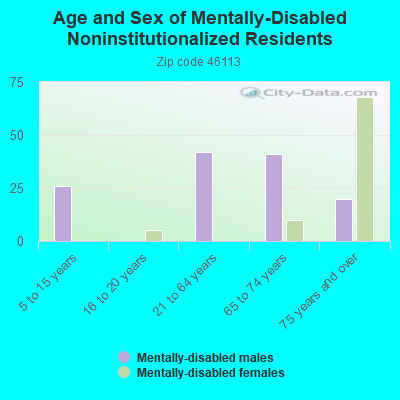
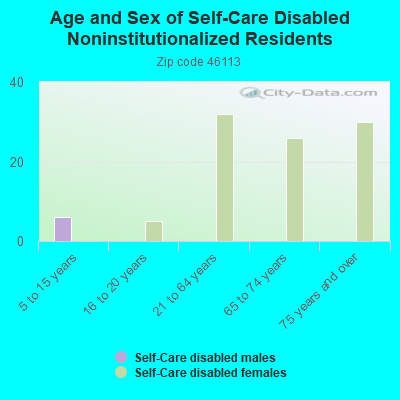
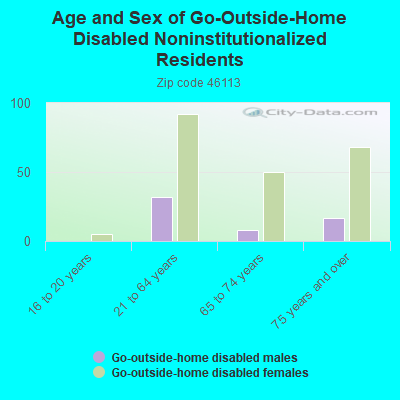
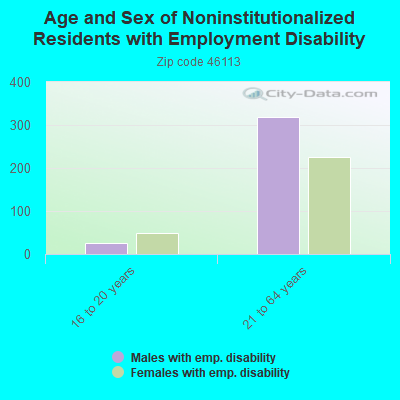
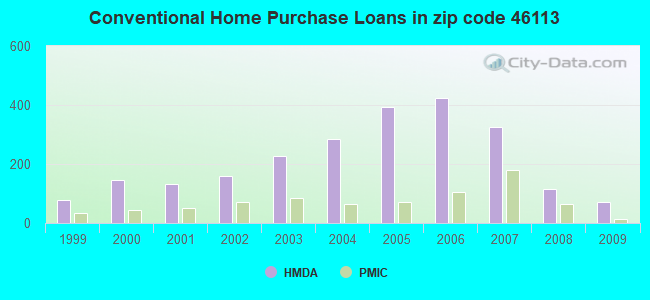
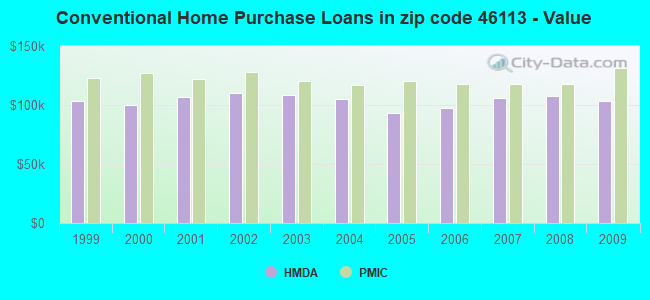
 According to the data from the years 2002 - 2018 the average number of fire incidents per year is 43. The highest number of fires - 75 took place in 2008, and the least - 4 in 2002. The data has a growing trend.
 When looking into fire subcategories, the most incidents belonged to: Structure Fires (51.9%), and Outside Fires (32.9%).