Crime rate in Norwalk, Connecticut (CT): murders, rapes, robberies, assaults, burglaries, thefts, auto thefts, arson, law enforcement employees, police officers, crime map
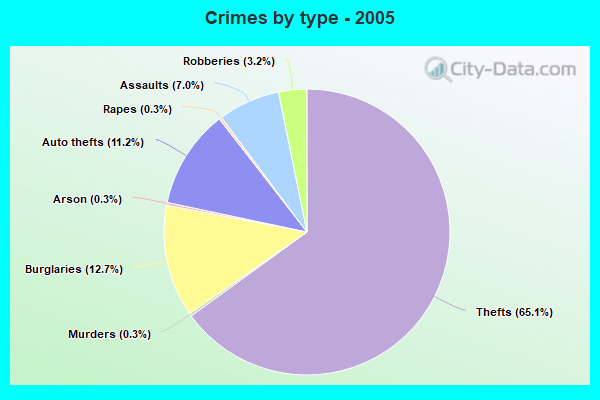
Crime rate in Norwalk, CT
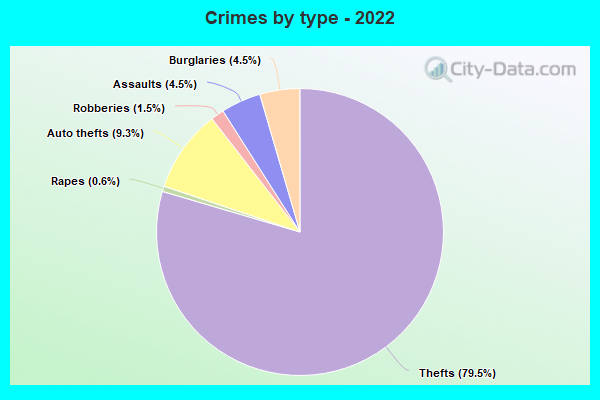
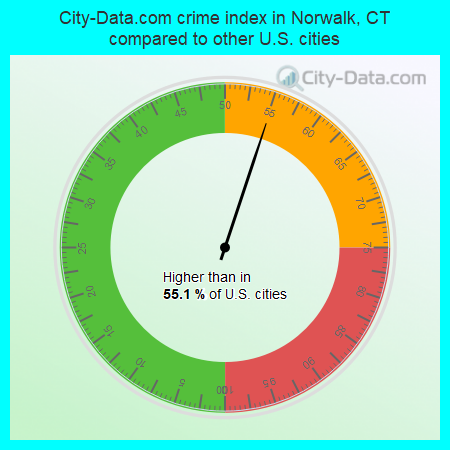
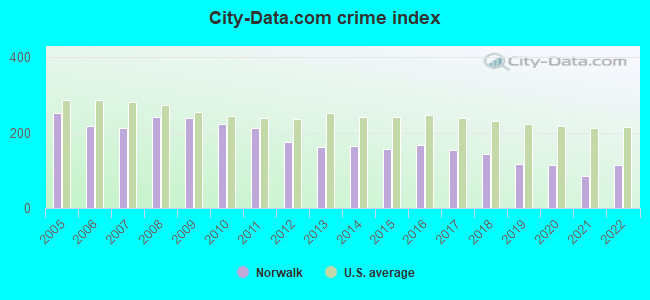
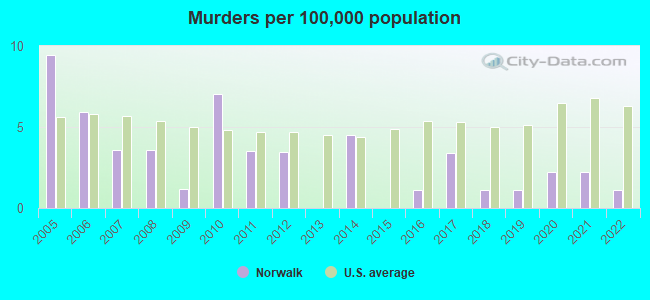
The 2022 crime rate in Norwalk, CT is 115 (City-Data.com crime index), which is 2.1 times smaller than the U.S. average. It was higher than in 55.1% U.S. cities. The 2022 Norwalk crime rate rose by 35% compared to 2021. The number of homicides stood at 1 - a decrease of 1 compared to 2021. In the last 5 years Norwalk has seen decline of violent crime and rise of property crime.See how dangerous Norwalk, CT is compared to the nearest cities:
(Note: Higher means more crime)
(Note: Higher means more crime)
| Norwalk: | 114.7 |
| Darien: | 72.3 |
| Westport: | 80.7 |
| New Canaan: | 42.2 |
| Wilton: | 36.5 |
| Stamford: | 112.1 |
| Weston: | 12.3 |
| Fairfield: | 92.3 |
| Pound Ridge: | 39.4 |
The City-Data.com crime index weighs serious crimes and violent crimes more heavily. Higher means more crime, U.S. average is 246.1. It adjusts for the number of visitors and daily workers commuting into cities.
- means the value is smaller than the state average.- means the value is about the same as the state average.
- means the value is bigger than the state average.
According to our research of Connecticut and other state lists, there were 55 registered sex offenders living in Norwalk, Connecticut as of May 21, 2024.
The ratio of all residents to sex offenders in Norwalk is 1,603 to 1.
The ratio of registered sex offenders to all residents in this city is lower than the state average.
Violent crime rate in 2022
| Norwalk: | 68.9 |
| U.S. Average: | 219.8 |
Violent crime rate in 2021
| Norwalk: | 37.1 |
| U.S. Average: | 224.8 |
Violent crime rate in 2020
| Norwalk: | 90.3 |
| U.S. Average: | 228.2 |
Violent crime rate in 2019
| Norwalk: | 108.5 |
| U.S. Average: | 219.9 |
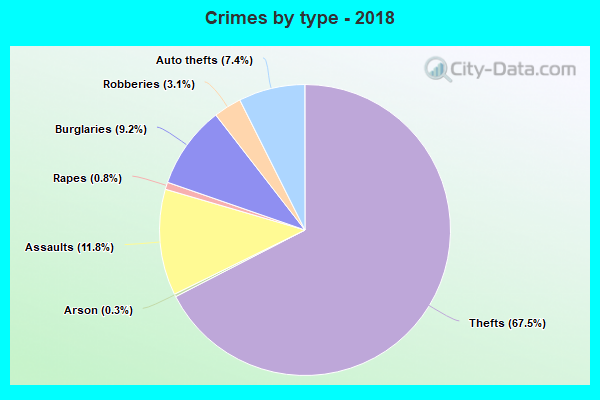
Violent crime rate in 2018
| Norwalk: | 149.8 |
| U.S. Average: | 221.2 |
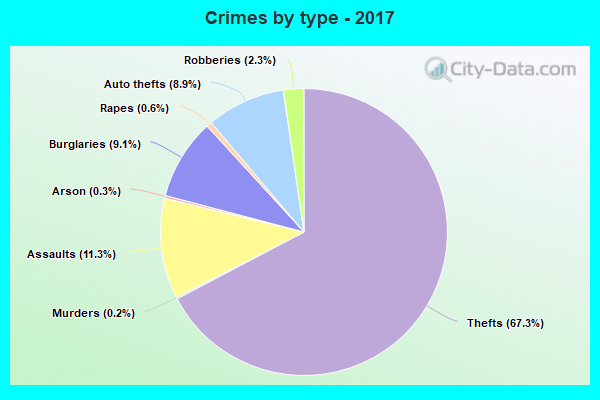
Violent crime rate in 2017
| Norwalk: | 154.2 |
| U.S. Average: | 226.2 |
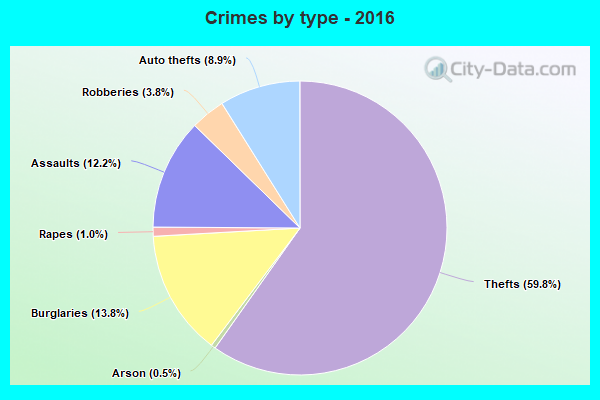
Violent crime rate in 2016
| Norwalk: | 177.6 |
| U.S. Average: | 227.3 |
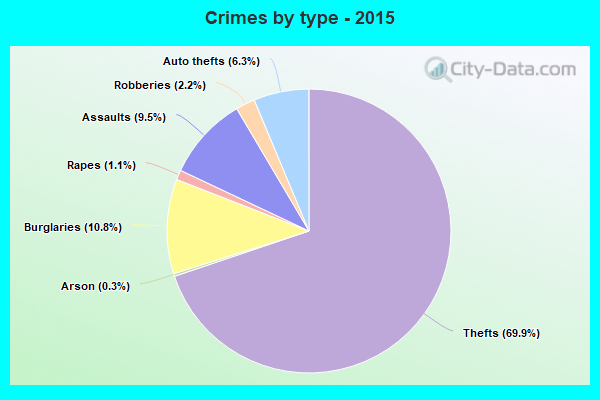
Violent crime rate in 2015
| Norwalk: | 146.0 |
| U.S. Average: | 219.3 |
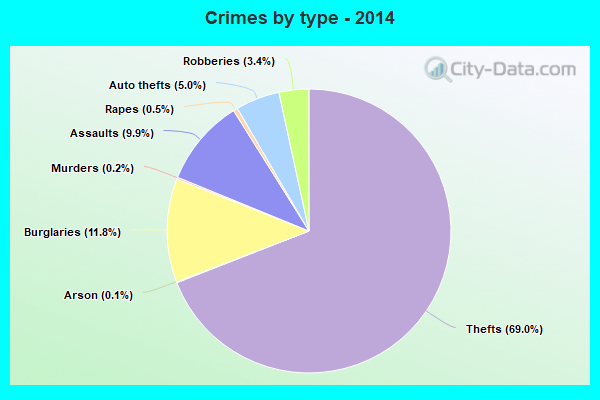
Violent crime rate in 2014
| Norwalk: | 161.5 |
| U.S. Average: | 211.1 |
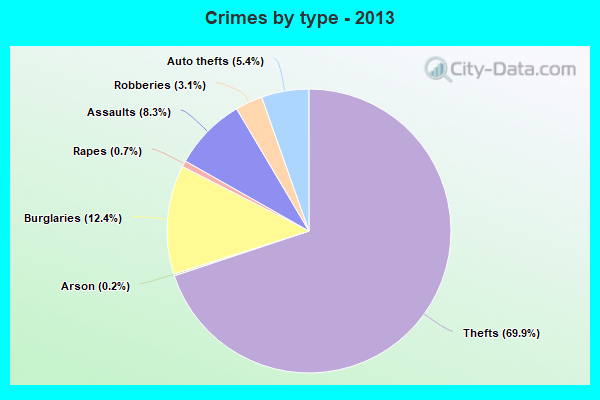
Violent crime rate in 2013
| Norwalk: | 143.3 |
| U.S. Average: | 214.2 |
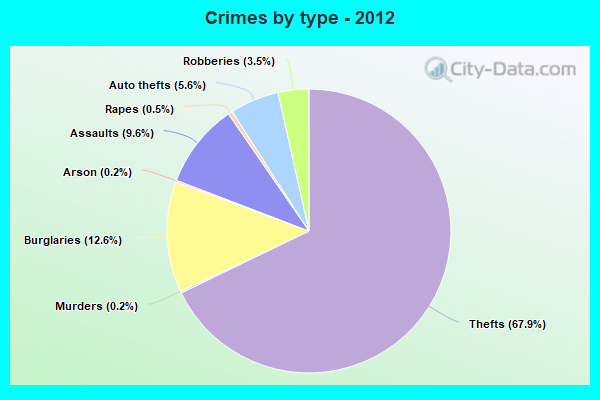
Violent crime rate in 2012
| Norwalk: | 167.8 |
| U.S. Average: | 187.4 |
Violent crime rate in 2011
| Norwalk: | 205.8 |
| U.S. Average: | 187.1 |
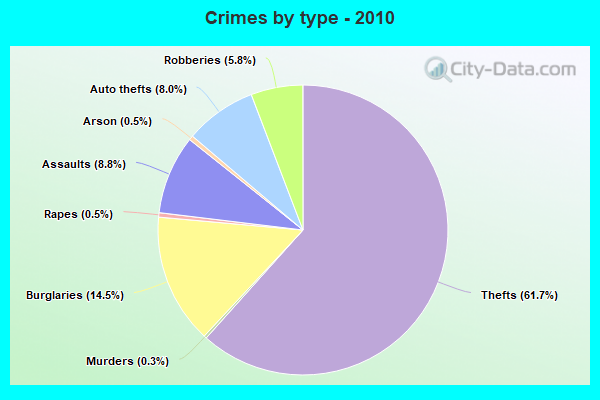
Violent crime rate in 2010
| Norwalk: | 217.9 |
| U.S. Average: | 195.7 |
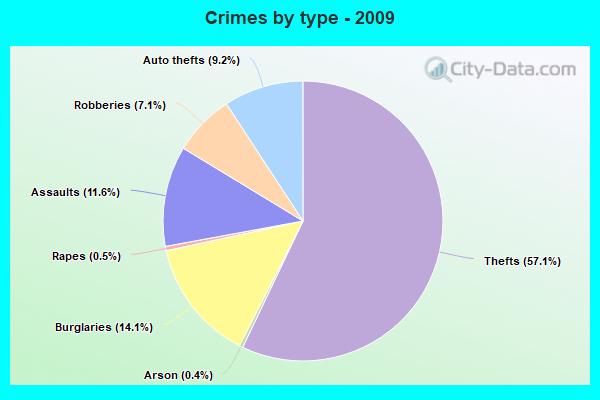
Violent crime rate in 2009
| Norwalk: | 266.8 |
| U.S. Average: | 208.9 |
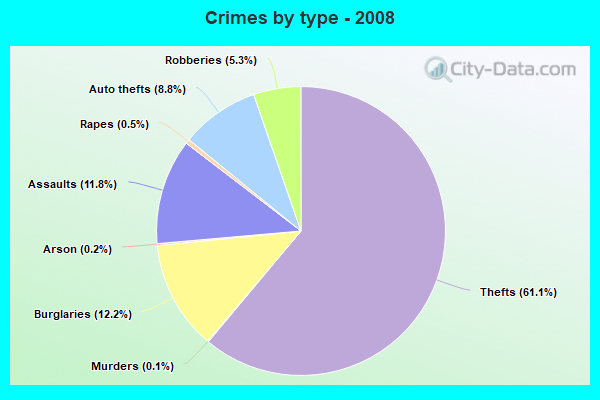
Violent crime rate in 2008
| Norwalk: | 261.7 |
| U.S. Average: | 222.5 |
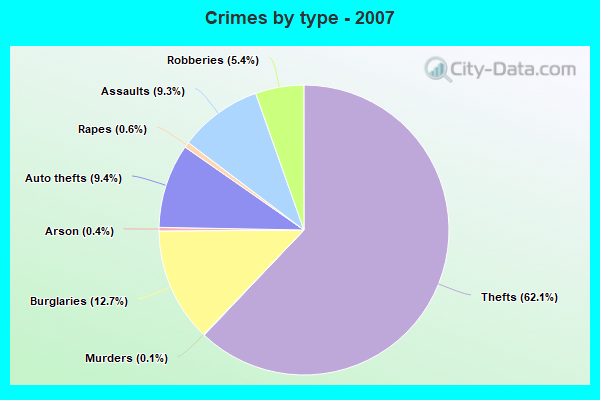
Violent crime rate in 2007
| Norwalk: | 209.3 |
| U.S. Average: | 229.1 |
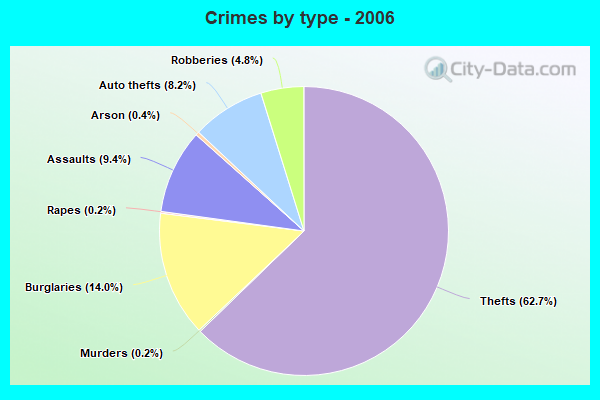
Violent crime rate in 2006
| Norwalk: | 210.5 |
| U.S. Average: | 232.6 |
Violent crime rate in 2005
| Norwalk: | 199.0 |
| U.S. Average: | 227.0 |
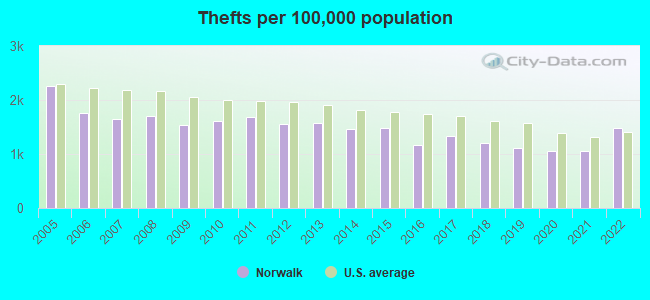
Property crime rate in 2022
| Norwalk: | 116.2 |
| U.S. Average: | 166.5 |
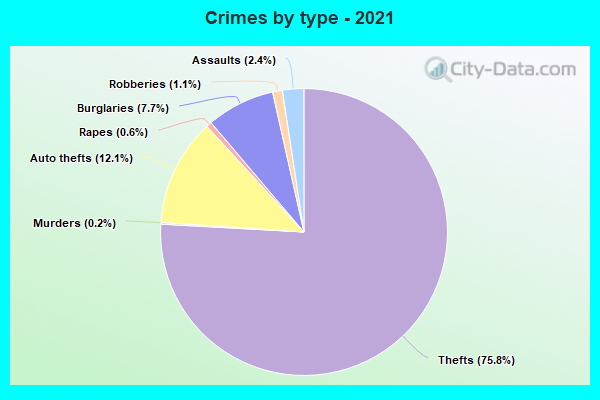
Property crime rate in 2021
| Norwalk: | 98.6 |
| U.S. Average: | 157.8 |
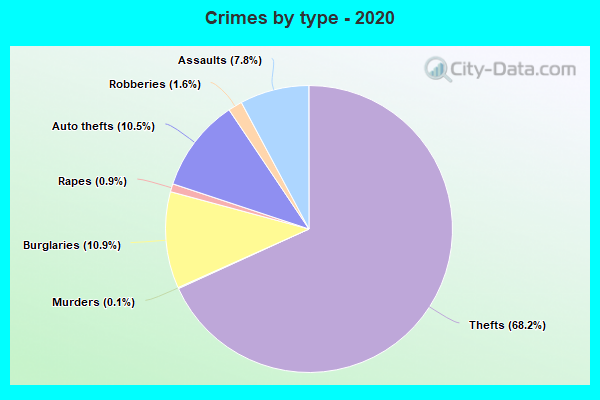
Property crime rate in 2020
| Norwalk: | 110.1 |
| U.S. Average: | 169.6 |
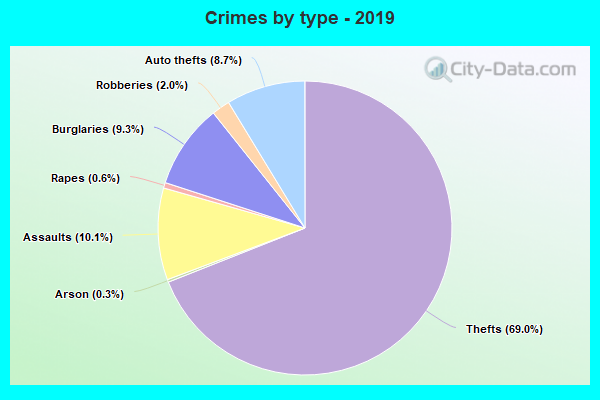
Property crime rate in 2019
| Norwalk: | 106.1 |
| U.S. Average: | 179.7 |
Property crime rate in 2018
| Norwalk: | 113.1 |
| U.S. Average: | 190.2 |
Property crime rate in 2017
| Norwalk: | 129.4 |
| U.S. Average: | 206.4 |
Property crime rate in 2016
| Norwalk: | 137.8 |
| U.S. Average: | 216.6 |
Property crime rate in 2015
| Norwalk: | 139.3 |
| U.S. Average: | 221.5 |
Property crime rate in 2014
| Norwalk: | 138.8 |
| U.S. Average: | 230.8 |
Property crime rate in 2013
| Norwalk: | 152.7 |
| U.S. Average: | 250.4 |
Property crime rate in 2012
| Norwalk: | 154.9 |
| U.S. Average: | 267.3 |
Property crime rate in 2011
| Norwalk: | 183.9 |
| U.S. Average: | 273.5 |
Property crime rate in 2010
| Norwalk: | 187.5 |
| U.S. Average: | 276.4 |
Property crime rate in 2009
| Norwalk: | 188.5 |
| U.S. Average: | 285.6 |
Property crime rate in 2008
| Norwalk: | 190.6 |
| U.S. Average: | 302.2 |
Property crime rate in 2007
| Norwalk: | 180.3 |
| U.S. Average: | 309.2 |
Property crime rate in 2006
| Norwalk: | 195.2 |
| U.S. Average: | 317.3 |
Property crime rate in 2005
| Norwalk: | 249.6 |
| U.S. Average: | 322.3 |
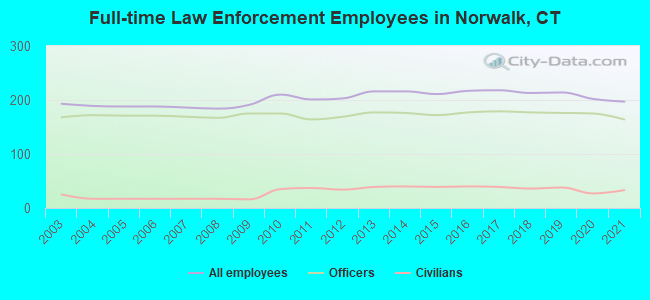
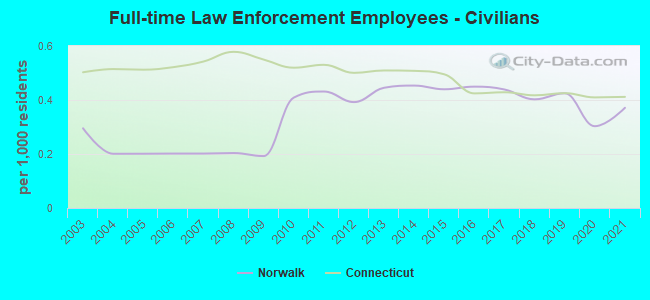
Full-time law enforcement employees in 2021, including police officers: 197 (164 officers - 147 male; 17 female).
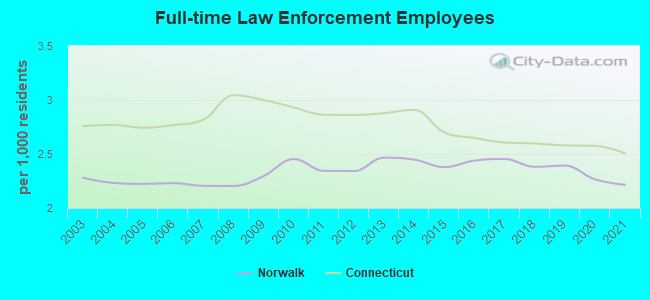
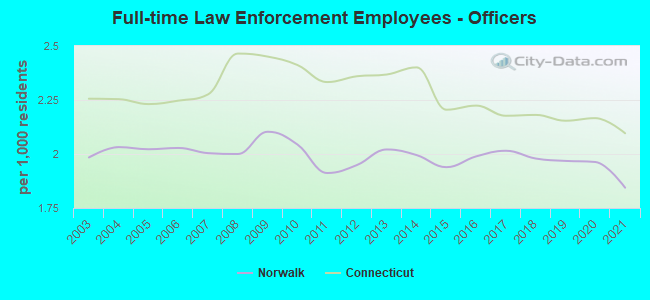
| Officers per 1,000 residents here: | 1.84 |
| Connecticut average: | 2.10 |
Full-time law enforcement employees in 2020, including police officers: 202 (175 officers - 159 male; 16 female).
| Officers per 1,000 residents here: | 1.96 |
| Connecticut average: | 2.17 |
Full-time law enforcement employees in 2019, including police officers: 214 (176 officers - 157 male; 19 female).
| Officers per 1,000 residents here: | 1.97 |
| Connecticut average: | 2.15 |
Full-time law enforcement employees in 2018, including police officers: 213 (177 officers - 159 male; 18 female).
| Officers per 1,000 residents here: | 1.98 |
| Connecticut average: | 2.18 |
Full-time law enforcement employees in 2017, including police officers: 218 (179 officers - 162 male; 17 female).
| Officers per 1,000 residents here: | 2.01 |
| Connecticut average: | 2.18 |
Full-time law enforcement employees in 2016, including police officers: 217 (177 officers - 164 male; 13 female).
| Officers per 1,000 residents here: | 1.99 |
| Connecticut average: | 2.22 |
Full-time law enforcement employees in 2015, including police officers: 211 (172 officers - 157 male; 15 female).
| Officers per 1,000 residents here: | 1.94 |
| Connecticut average: | 2.21 |
Full-time law enforcement employees in 2014, including police officers: 216 (176 officers - 161 male; 15 female).
| Officers per 1,000 residents here: | 1.99 |
| Connecticut average: | 2.40 |
Full-time law enforcement employees in 2013, including police officers: 216 (177 officers - 166 male; 11 female).
| Officers per 1,000 residents here: | 2.02 |
| Connecticut average: | 2.37 |
Full-time law enforcement employees in 2012, including police officers: 203 (169 officers - 152 male; 17 female).
| Officers per 1,000 residents here: | 1.95 |
| Connecticut average: | 2.36 |
Full-time law enforcement employees in 2011, including police officers: 201 (164 officers - 152 male; 12 female).
| Officers per 1,000 residents here: | 1.91 |
| Connecticut average: | 2.33 |
Full-time law enforcement employees in 2010, including police officers: 210 (175 officers - 159 male; 16 female).
| Officers per 1,000 residents here: | 2.04 |
| Connecticut average: | 2.41 |
Full-time law enforcement employees in 2009, including police officers: 191 (175 officers - 159 male; 16 female).
| Officers per 1,000 residents here: | 2.10 |
| Connecticut average: | 2.45 |
Full-time law enforcement employees in 2008, including police officers: 184 (167 officers - 151 male; 16 female).
| Officers per 1,000 residents here: | 2.00 |
| Connecticut average: | 2.47 |
Full-time law enforcement employees in 2007, including police officers: 186 (169 officers - 153 male; 16 female).
| Officers per 1,000 residents here: | 2.00 |
| Connecticut average: | 2.28 |
Full-time law enforcement employees in 2006, including police officers: 188 (171 officers - 155 male; 16 female).
| Officers per 1,000 residents here: | 2.03 |
| Connecticut average: | 2.25 |
Full-time law enforcement employees in 2005, including police officers: 188 (171 officers - 155 male; 16 female).
| Officers per 1,000 residents here: | 2.02 |
| Connecticut average: | 2.23 |
Full-time law enforcement employees in 2004, including police officers: 189 (172 officers - 156 male; 16 female).
| Officers per 1,000 residents here: | 2.03 |
| Connecticut average: | 2.25 |
Full-time law enforcement employees in 2003, including police officers: 193 (168 officers - 151 male; 17 female).
| Officers per 1,000 residents here: | 1.98 |
| Connecticut average: | 2.26 |