Crime rate in Stamford, Connecticut (CT): murders, rapes, robberies, assaults, burglaries, thefts, auto thefts, arson, law enforcement employees, police officers, crime map
Crime rate in Stamford, CT
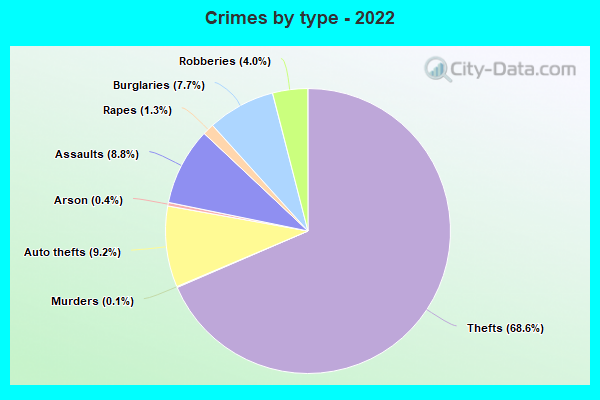
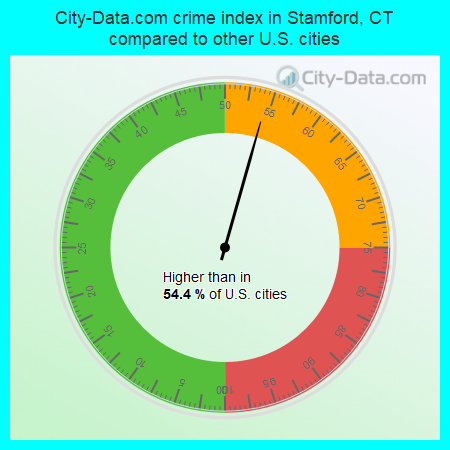
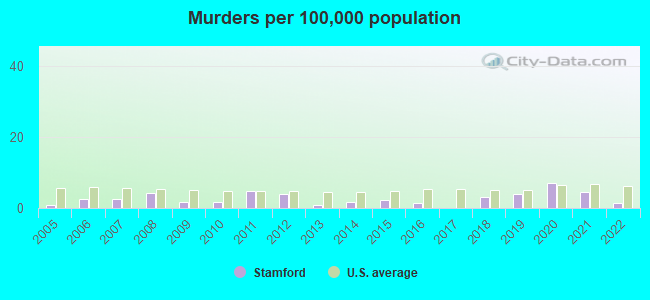
The 2022 crime rate in Stamford, CT is 112 (City-Data.com crime index), which is 2.2 times lower than the U.S. average. It was higher than in 54.4% U.S. cities. The 2022 Stamford crime rate fell by 15% compared to 2021. The number of homicides stood at 2 - a decrease of 4 compared to 2021. In the last 5 years Stamford has seen increasing violent crime and decreasing property crime.See how dangerous Stamford, CT is compared to the nearest cities:
(Note: Higher means more crime)
(Note: Higher means more crime)
| Stamford: | 112.1 |
| Darien: | 72.3 |
| Greenwich: | 64.0 |
| New Canaan: | 42.2 |
| Norwalk: | 114.7 |
| Port Chester: | 61.6 |
| Rye Brook: | 44.4 |
| North Castle: | 47.3 |
| Pound Ridge: | 39.4 |
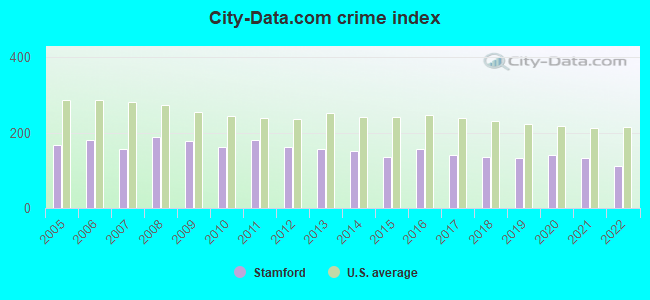
The City-Data.com crime index weighs serious crimes and violent crimes more heavily. Higher means more crime, U.S. average is 246.1. It adjusts for the number of visitors and daily workers commuting into cities.
- means the value is smaller than the state average.- means the value is about the same as the state average.
- means the value is bigger than the state average.
According to our research of Connecticut and other state lists, there were 67 registered sex offenders living in Stamford, Connecticut as of May 21, 2024.
The ratio of all residents to sex offenders in Stamford is 1,927 to 1.
The ratio of registered sex offenders to all residents in this city is much lower than the state average.
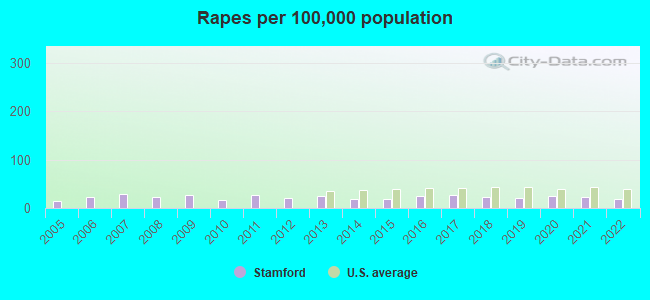
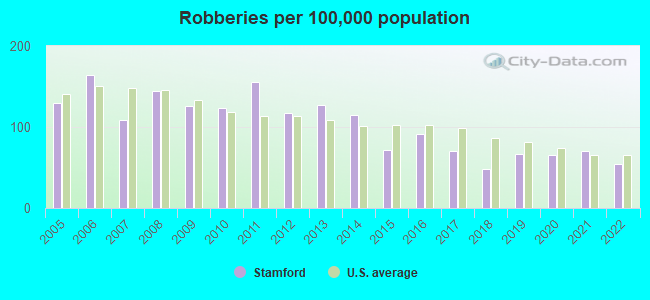
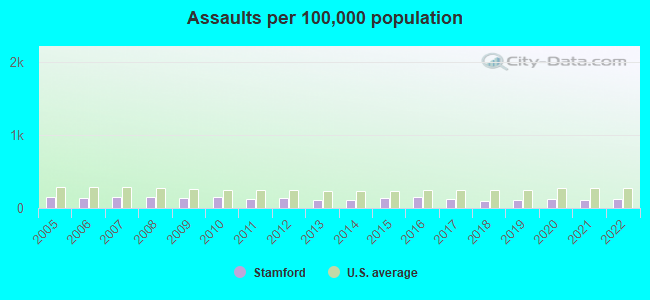
Violent crime rate in 2022
| Stamford: | 107.3 |
| U.S. Average: | 219.8 |
Violent crime rate in 2021
| Stamford: | 119.4 |
| U.S. Average: | 224.8 |
Violent crime rate in 2020
| Stamford: | 134.6 |
| U.S. Average: | 228.2 |
Violent crime rate in 2019
| Stamford: | 116.7 |
| U.S. Average: | 219.9 |
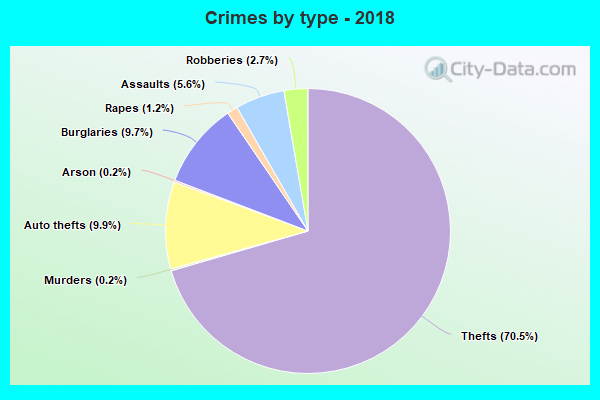
Violent crime rate in 2018
| Stamford: | 102.6 |
| U.S. Average: | 221.2 |
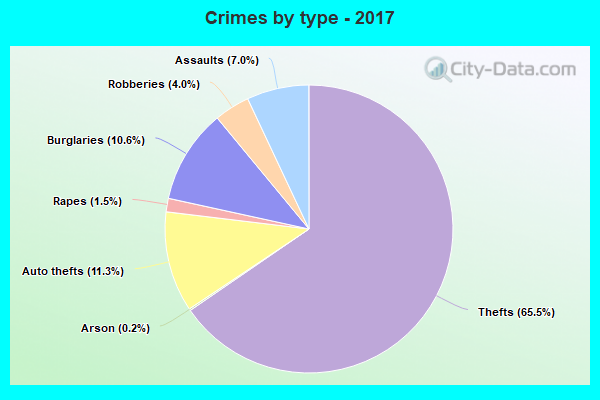
Violent crime rate in 2017
| Stamford: | 122.5 |
| U.S. Average: | 226.2 |
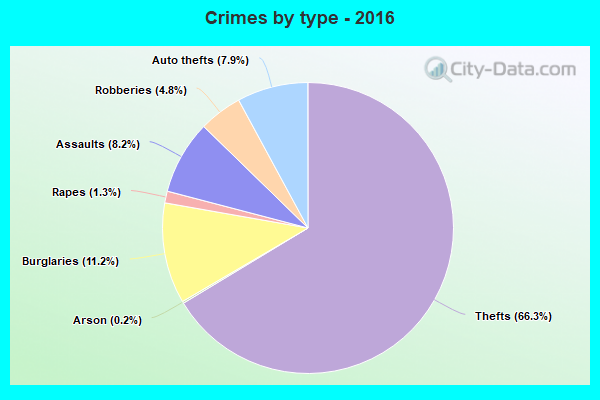
Violent crime rate in 2016
| Stamford: | 151.0 |
| U.S. Average: | 227.3 |
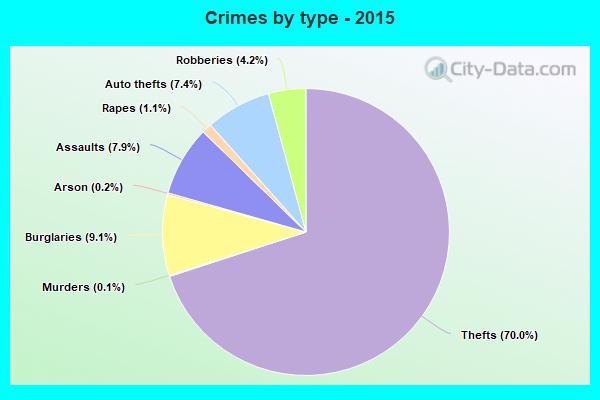
Violent crime rate in 2015
| Stamford: | 124.1 |
| U.S. Average: | 219.3 |
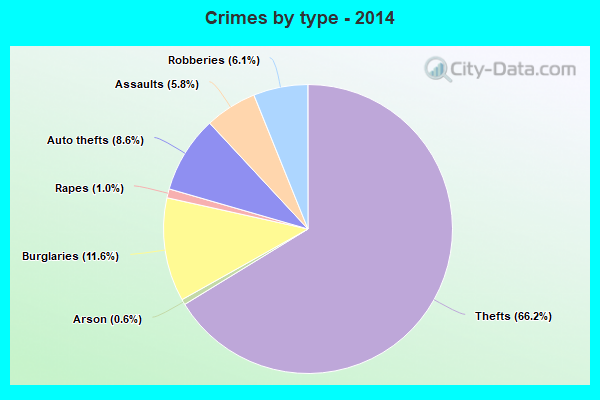
Violent crime rate in 2014
| Stamford: | 133.1 |
| U.S. Average: | 211.1 |
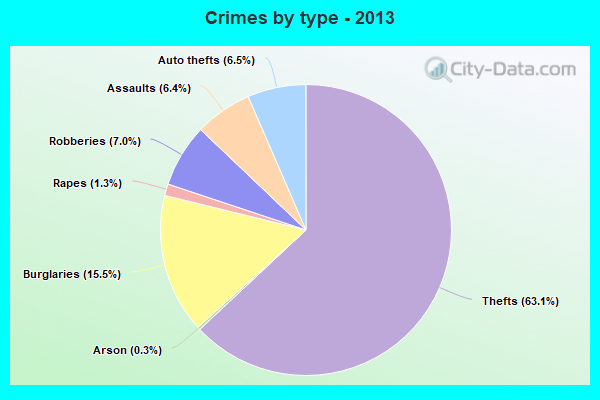
Violent crime rate in 2013
| Stamford: | 147.0 |
| U.S. Average: | 214.2 |
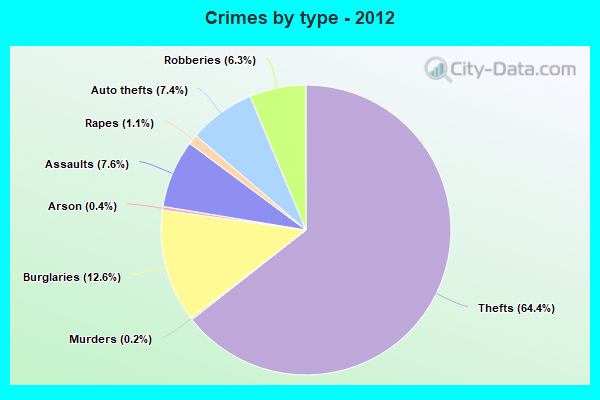
Violent crime rate in 2012
| Stamford: | 157.8 |
| U.S. Average: | 187.4 |
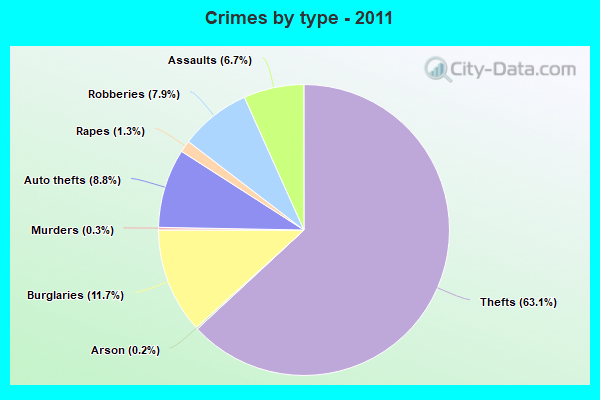
Violent crime rate in 2011
| Stamford: | 178.2 |
| U.S. Average: | 187.1 |
Violent crime rate in 2010
| Stamford: | 153.3 |
| U.S. Average: | 195.7 |
Violent crime rate in 2009
| Stamford: | 162.3 |
| U.S. Average: | 208.9 |
Violent crime rate in 2008
| Stamford: | 182.1 |
| U.S. Average: | 222.5 |
Violent crime rate in 2007
| Stamford: | 149.4 |
| U.S. Average: | 229.1 |
Violent crime rate in 2006
| Stamford: | 167.1 |
| U.S. Average: | 232.6 |
Violent crime rate in 2005
| Stamford: | 144.7 |
| U.S. Average: | 227.0 |
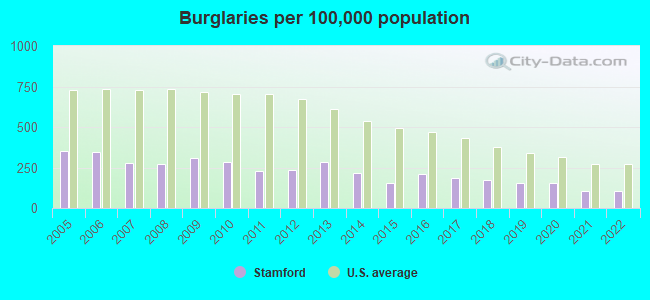
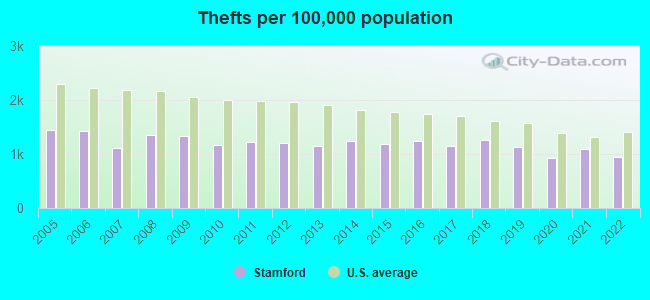
Property crime rate in 2022
| Stamford: | 86.8 |
| U.S. Average: | 166.5 |
Property crime rate in 2021
| Stamford: | 97.1 |
| U.S. Average: | 157.8 |
Property crime rate in 2020
| Stamford: | 104.3 |
| U.S. Average: | 169.6 |
Property crime rate in 2019
| Stamford: | 105.5 |
| U.S. Average: | 179.7 |
Property crime rate in 2018
| Stamford: | 125.0 |
| U.S. Average: | 190.2 |
Property crime rate in 2017
| Stamford: | 124.5 |
| U.S. Average: | 206.4 |
Property crime rate in 2016
| Stamford: | 126.5 |
| U.S. Average: | 216.6 |
Property crime rate in 2015
| Stamford: | 108.5 |
| U.S. Average: | 221.5 |
Property crime rate in 2014
| Stamford: | 129.8 |
| U.S. Average: | 230.8 |
Property crime rate in 2013
| Stamford: | 131.4 |
| U.S. Average: | 250.4 |
Property crime rate in 2012
| Stamford: | 127.2 |
| U.S. Average: | 267.3 |
Property crime rate in 2011
| Stamford: | 132.9 |
| U.S. Average: | 273.5 |
Property crime rate in 2010
| Stamford: | 139.0 |
| U.S. Average: | 276.4 |
Property crime rate in 2009
| Stamford: | 150.9 |
| U.S. Average: | 285.6 |
Property crime rate in 2008
| Stamford: | 149.5 |
| U.S. Average: | 302.2 |
Property crime rate in 2007
| Stamford: | 131.1 |
| U.S. Average: | 309.2 |
Property crime rate in 2006
| Stamford: | 152.3 |
| U.S. Average: | 317.3 |
Property crime rate in 2005
| Stamford: | 158.4 |
| U.S. Average: | 322.3 |
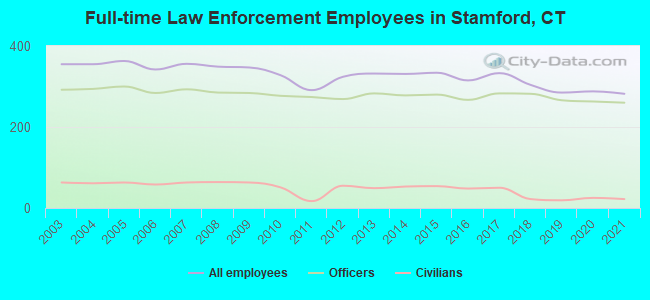
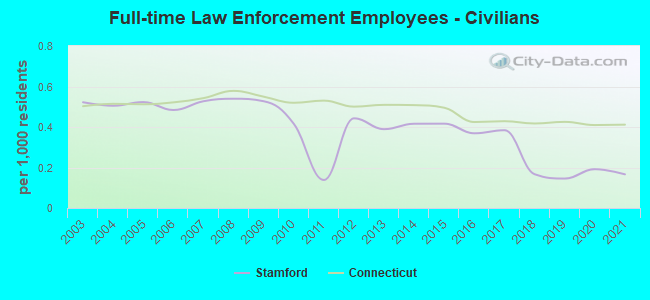
Full-time law enforcement employees in 2021, including police officers: 282 (260 officers - 235 male; 25 female).
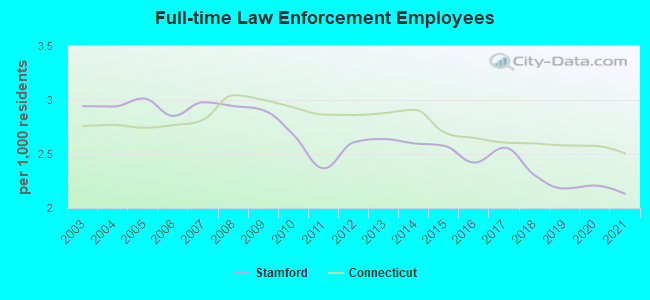
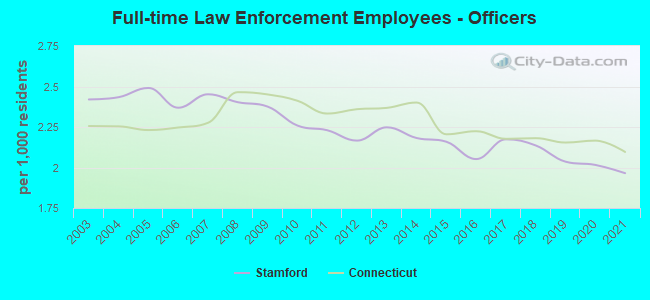
| Officers per 1,000 residents here: | 1.97 |
| Connecticut average: | 2.10 |
Full-time law enforcement employees in 2020, including police officers: 288 (263 officers - 236 male; 27 female).
| Officers per 1,000 residents here: | 2.02 |
| Connecticut average: | 2.17 |
Full-time law enforcement employees in 2019, including police officers: 285 (266 officers - 243 male; 23 female).
| Officers per 1,000 residents here: | 2.04 |
| Connecticut average: | 2.15 |
Full-time law enforcement employees in 2018, including police officers: 304 (282 officers - 253 male; 29 female).
| Officers per 1,000 residents here: | 2.14 |
| Connecticut average: | 2.18 |
Full-time law enforcement employees in 2017, including police officers: 333 (283 officers - 254 male; 29 female).
| Officers per 1,000 residents here: | 2.17 |
| Connecticut average: | 2.18 |
Full-time law enforcement employees in 2016, including police officers: 315 (267 officers - 243 male; 24 female).
| Officers per 1,000 residents here: | 2.05 |
| Connecticut average: | 2.22 |
Full-time law enforcement employees in 2015, including police officers: 334 (280 officers - 258 male; 22 female).
| Officers per 1,000 residents here: | 2.16 |
| Connecticut average: | 2.21 |
Full-time law enforcement employees in 2014, including police officers: 331 (278 officers - 258 male; 20 female).
| Officers per 1,000 residents here: | 2.18 |
| Connecticut average: | 2.40 |
Full-time law enforcement employees in 2013, including police officers: 332 (283 officers - 262 male; 21 female).
| Officers per 1,000 residents here: | 2.25 |
| Connecticut average: | 2.37 |
Full-time law enforcement employees in 2012, including police officers: 324 (269 officers - 247 male; 22 female).
| Officers per 1,000 residents here: | 2.17 |
| Connecticut average: | 2.36 |
Full-time law enforcement employees in 2011, including police officers: 291 (274 officers - 252 male; 22 female).
| Officers per 1,000 residents here: | 2.23 |
| Connecticut average: | 2.33 |
Full-time law enforcement employees in 2010, including police officers: 328 (277 officers - 255 male; 22 female).
| Officers per 1,000 residents here: | 2.26 |
| Connecticut average: | 2.41 |
Full-time law enforcement employees in 2009, including police officers: 347 (284 officers - 262 male; 22 female).
| Officers per 1,000 residents here: | 2.38 |
| Connecticut average: | 2.45 |
Full-time law enforcement employees in 2008, including police officers: 349 (285 officers - 264 male; 21 female).
| Officers per 1,000 residents here: | 2.40 |
| Connecticut average: | 2.47 |
Full-time law enforcement employees in 2007, including police officers: 356 (293 officers - 270 male; 23 female).
| Officers per 1,000 residents here: | 2.45 |
| Connecticut average: | 2.28 |
Full-time law enforcement employees in 2006, including police officers: 342 (284 officers - 262 male; 22 female).
| Officers per 1,000 residents here: | 2.37 |
| Connecticut average: | 2.25 |
Full-time law enforcement employees in 2005, including police officers: 363 (300 officers - 276 male; 24 female).
| Officers per 1,000 residents here: | 2.49 |
| Connecticut average: | 2.23 |
Full-time law enforcement employees in 2004, including police officers: 355 (294 officers - 275 male; 19 female).
| Officers per 1,000 residents here: | 2.43 |
| Connecticut average: | 2.25 |
Full-time law enforcement employees in 2003, including police officers: 355 (292 officers - 271 male; 21 female).
| Officers per 1,000 residents here: | 2.42 |
| Connecticut average: | 2.26 |