Abbeville: Fire Incidents, Louisiana (LA)
Where are fire incidents reported in Abbeville, LA
Something went wrong! Please refresh the page.
| Fire incidents reported | |
|---|---|
| Sreet name | Count |
| VETERANS MEMORIAL DR | 92 |
| MARTIN LUTHER KING DR | 80 |
| CHARITY ST | 50 |
| HWY 167 | 50 |
| LOUISIANA ST | 48 |
| STATE ST | 46 |
| GUEGNON ST | 40 |
| HWY 333 | 40 |
| GRACELAND AVE | 34 |
| HWY 82 | 30 |
| RODEO RD | 30 |
| HOSPITAL DR | 26 |
| LAMAR ST | 26 |
| MILES ST | 26 |
| ADIER RD | 24 |
| HWY 330 | 24 |
| PORT ST | 22 |
| 1234 | 20 |
| BAILEY ST | 20 |
| EAST ST | 20 |
| HWY 14 | 20 |
| HWY 338 | 20 |
| JOHN HARDY DR | 20 |
| GRACELAND | 18 |
| BIRCH RD | 16 |
| LAFAYETTE ST | 16 |
| LAURA ST | 16 |
| LOUISIANA | 16 |
| AIRPORT RD | 14 |
| FAIRMOUNT AVE | 14 |
| Other | 846 |
2002 - 2018 National Fire Incident Reporting System (NFIRS) incidents
- Incident types reported to NFIRS in Abbeville, LA
- 3,63349.3%Rescue & EMS
- 1,76424.0%Fire
- 6418.7%Hazardous Condition
- 6028.2%False Alarm
- 5617.6%Good Intent Call
- 1011.4%Service Call
- 250.3%Overpressure Rupture
- 250.3%Severe Weather
- 120.2%Special Incident
- Fire incident types reported to NFIRS in Abbeville, LA
- 83747.4%Structure Fires
- 50228.5%Outside Fires
- 27215.4%Mobile Property/Vehicle Fires
- 1538.7%Other
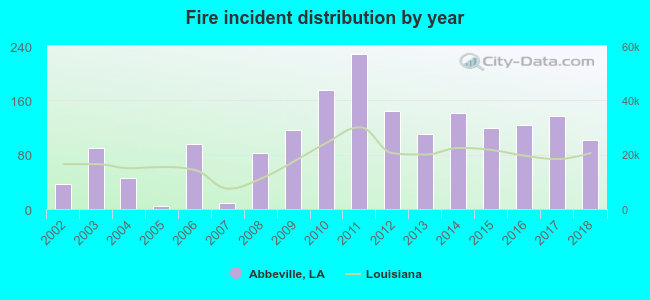 Based on the data from the years 2002 - 2018 the average number of fire incidents per year is 104. The highest number of fires - 228 took place in 2011, and the least - 4 in 2005. The data has an increasing trend.
The average number of yearly fire incidents per 10k residents in Abbeville, LA compared to nearest cities:
(Note: Based on data for the last 3 years, including only cities with population 5,000 and above)
| Abbeville: | 97.2 |
| Youngsville: | 83.6 |
| Broussard: | 79.8 |
| Lafayette: | 36.2 |
| Scott: | 94.7 |
| New Iberia: | 71.1 |
| Rayne: | 54.3 |
| Crowley: | 64.4 |
| Carencro: | 113.6 |
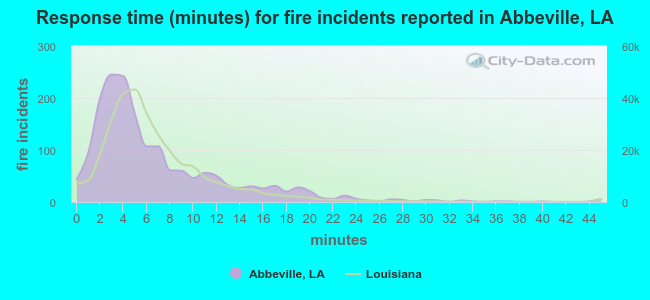 The median response time based on all reported fire incidents is 5 minutes. This is lower compared to the Louisiana median value.
The median response time in Abbeville, LA compared to nearest cities:
(Note: Based on data for all years, including only cities with at least 500 fire incidents)
| Abbeville: | 5 minutes |
| Erath: | 9 minutes |
| Kaplan: | 6 minutes |
| Youngsville: | 7 minutes |
| Broussard: | 7 minutes |
| Lafayette: | 5 minutes |
| Scott: | 9 minutes |
| Duson: | 8 minutes |
| New Iberia: | 4 minutes |
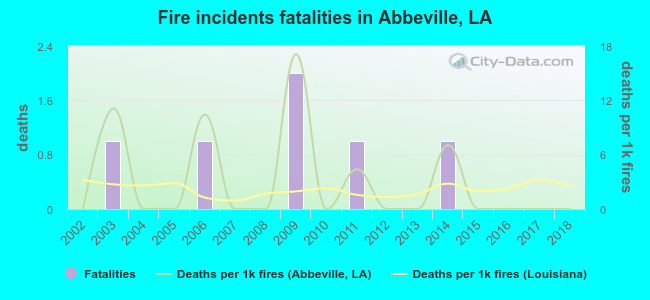 Based on the reports from the years 2002 - 2018 the average number of fire-related yearly deaths is 0. The highest number of reported deaths - 2 took place in 2009, and the lowest - 0 in 2002. The data has a constant trend.
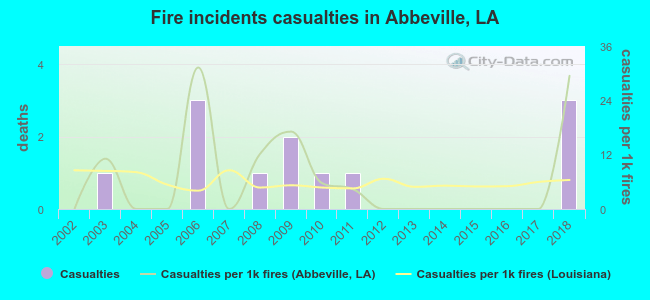 According to the data from the years 2002 - 2018 the average number of fire-related casualties per year is 1. The highest number of injuries - 3 took place in 2006, and the lowest - 0 in 2002. The data has a growing trend.
The average number of casualties per 1,000 fire incidents is 7. This indicator was the highest - 31 in 2006, and the lowest 0 in 2002. The trend for casualties per 1,000 incidents is growing. Compared to the Louisiana value the number of casualties per 1,000 incidents is similar.
According to the data from the years 2002 - 2018 the average number of fire-related casualties per year is 1. The highest number of injuries - 3 took place in 2006, and the lowest - 0 in 2002. The data has a growing trend.
The average number of casualties per 1,000 fire incidents is 7. This indicator was the highest - 31 in 2006, and the lowest 0 in 2002. The trend for casualties per 1,000 incidents is growing. Compared to the Louisiana value the number of casualties per 1,000 incidents is similar.Casualties per 1,000 incidents in Abbeville, LA compared to nearest cities:
(Note: Based on data for all years, including only cities with at least 500 fire incidents)
| Abbeville: | 6.8 |
| Erath: | 0.0 |
| Kaplan: | 0.0 |
| Youngsville: | 3.6 |
| Broussard: | 5.3 |
| Lafayette: | 13.5 |
| Scott: | 4.3 |
| Duson: | 0.0 |
| New Iberia: | 11.6 |
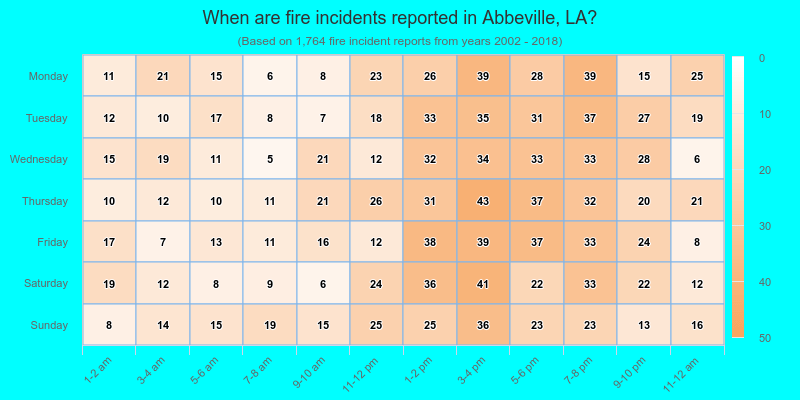
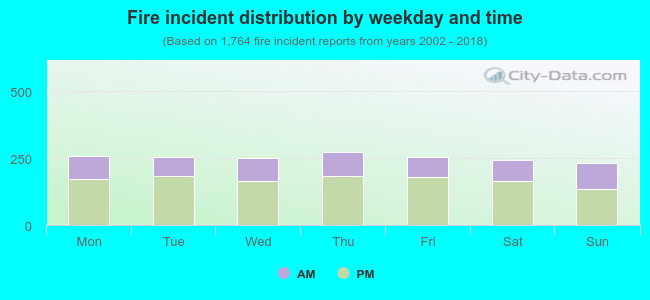 32.8% incidents where reported in the morning and 67.2% in the evening. The most fires (15.5%) took place on Thursday, and the least (13.2%) on Sunday.
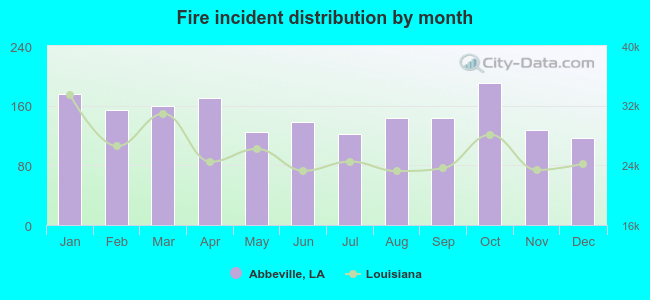 According to the 1,764 fires from years 2002 - 2018 most fires (10.8%) took place during October, and the least (6.6%) in December.
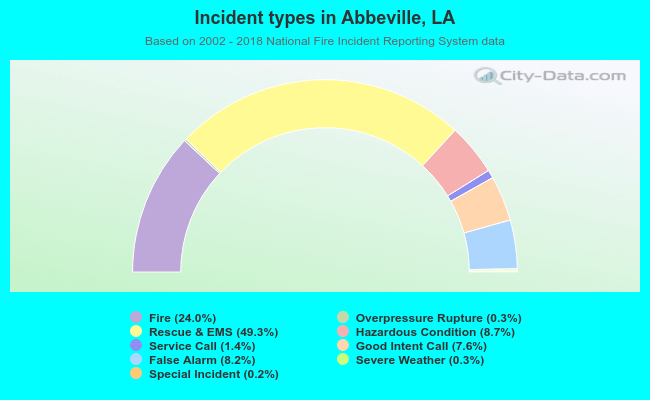 Out of all 7,364 cases reported during the years 2002 - 2018, the most belonged to the categories: Rescue & EMS (49.3%), Fire (24.0%), and Hazardous Condition (8.7%).
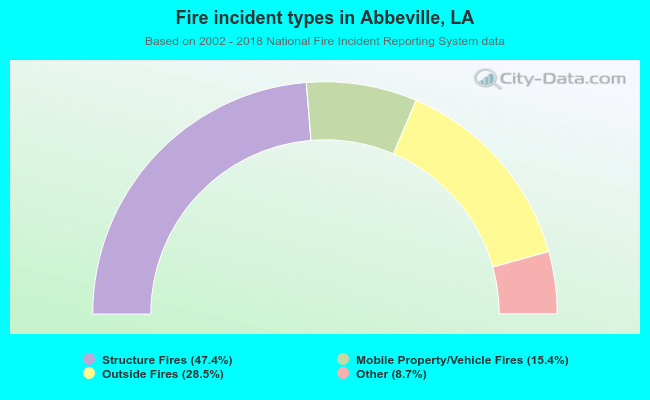 When looking into fire subcategories, the most reports belonged to: Structure Fires (47.4%), and Outside Fires (28.5%).