Lafayette: Fire Incidents, Louisiana (LA)
Where are fire incidents reported in Lafayette, LA
Something went wrong! Please refresh the page.
| Fire incidents reported | |
|---|---|
| Sreet name | Count |
| AMBASSADOR CAFFERY PKY | 488 |
| JOHNSTON ST | 424 |
| EVANGELINE THRUWAY | 246 |
| VEROT SCHOOL RD | 220 |
| MOSS ST | 206 |
| KALISTE SALOOM RD | 188 |
| CARMEL DR | 182 |
| PINHOOK RD | 162 |
| LOUISIANA AVE | 156 |
| EVANGELINE THRU-WAY | 152 |
| MARTIN LUTHER KING JR DR | 128 |
| UNIVERSITY AVE | 128 |
| CONGRESS ST | 118 |
| CAMERON ST | 110 |
| WILLOW ST | 94 |
| I10 | 90 |
| INTERSTATE 10 | 86 |
| GUILBEAU RD | 82 |
| JEFFERSON ST | 78 |
| SIMCOE ST | 78 |
| ROBLEY DR | 72 |
| BROUSSARD RD | 68 |
| GLORIA SWITCH RD | 64 |
| W CONGRESS ST | 62 |
| WALKER RD | 60 |
| MILTON AVE | 58 |
| BERTRAND DR | 56 |
| BUTCHER SWITCH RD | 56 |
| UNIVERSITY | 56 |
| PONT DES MOUTON RD | 54 |
| Other | 2,879 |
2002 - 2018 National Fire Incident Reporting System (NFIRS) incidents
- Incident types reported to NFIRS in Lafayette, LA
- 21,64737.9%Rescue & EMS
- 16,55829.0%Hazardous Condition
- 6,90112.1%Fire
- 5,1579.0%False Alarm
- 3,2495.7%Good Intent Call
- 3,1025.4%Service Call
- 2020.4%Special Incident
- 1310.2%Overpressure Rupture
- 1060.2%Severe Weather
- Fire incident types reported to NFIRS in Lafayette, LA
- 2,77140.2%Outside Fires
- 2,46035.6%Structure Fires
- 1,34819.5%Mobile Property/Vehicle Fires
- 3224.7%Other
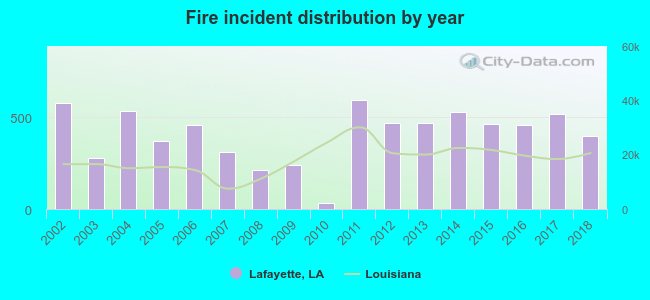 According to the data from the years 2002 - 2018 the average number of fire incidents per year is 406. The highest number of reported fires - 592 took place in 2011, and the least - 30 in 2010. The data has a dropping trend.
The average number of yearly fire incidents per 10k residents in Lafayette, LA compared to nearest cities:
(Note: Based on data for the last 3 years, including only cities with population 5,000 and above)
| Lafayette: | 36.2 |
| Scott: | 94.7 |
| Broussard: | 79.8 |
| Carencro: | 113.6 |
| Youngsville: | 83.6 |
| Breaux Bridge: | 124.5 |
| Rayne: | 54.3 |
| Abbeville: | 97.2 |
| New Iberia: | 71.1 |
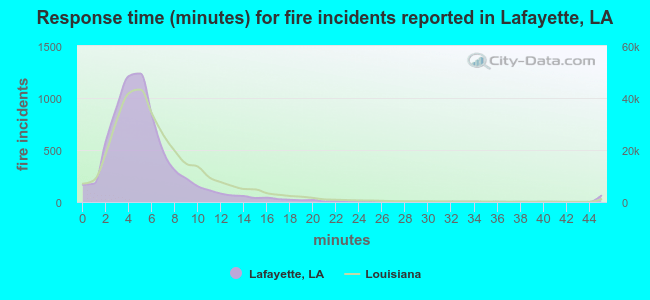 The median response time based on all reported fire incidents is 5 minutes. This is lower than the Louisiana median value.
The median response time in Lafayette, LA compared to nearest cities:
(Note: Based on data for all years, including only cities with at least 500 fire incidents)
| Lafayette: | 5 minutes |
| Scott: | 9 minutes |
| Broussard: | 7 minutes |
| Carencro: | 8 minutes |
| Youngsville: | 7 minutes |
| Breaux Bridge: | 11 minutes |
| Duson: | 8 minutes |
| Arnaudville: | 11 minutes |
| Rayne: | 6 minutes |
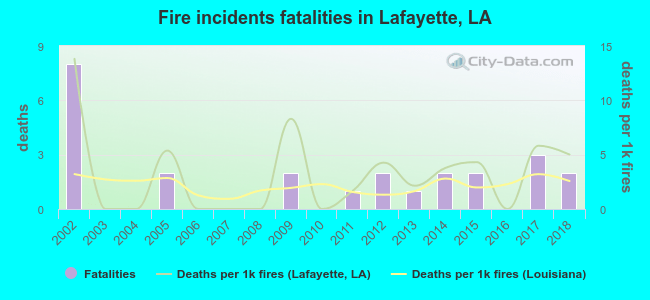 Based on the data from the years 2002 - 2018 the average number of fire-related fatalities per year is 1. The highest number of deaths - 8 took place in 2002, and the lowest - 0 in 2003. The data has a decreasing trend.
The average number of deaths per 1,000 fire incidents is 3. This indicator was the highest - 14 in 2002, and the lowest 0 in 2003. The trend for deaths per 1,000 fires is decreasing. Compared to the Louisiana value the number of fatalities per 1,000 incidents is higher.
Based on the data from the years 2002 - 2018 the average number of fire-related fatalities per year is 1. The highest number of deaths - 8 took place in 2002, and the lowest - 0 in 2003. The data has a decreasing trend.
The average number of deaths per 1,000 fire incidents is 3. This indicator was the highest - 14 in 2002, and the lowest 0 in 2003. The trend for deaths per 1,000 fires is decreasing. Compared to the Louisiana value the number of fatalities per 1,000 incidents is higher.Deaths per 1,000 incidents in Lafayette, LA compared to nearest cities:
(Note: Based on data for all years, including only cities with at least 2,500 fire incidents)
| Lafayette: | 3.6 |
| New Iberia: | 2.1 |
| Opelousas: | 3.3 |
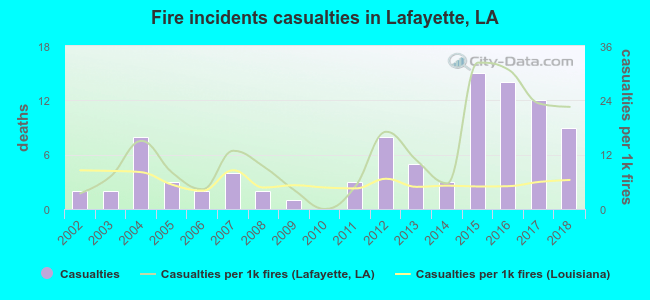 Based on the data from the years 2002 - 2018 the average number of fire-related casualties per year is 5. The highest number of injuries - 15 took place in 2015, and the lowest - 0 in 2010. The data has an increasing trend.
The average number of injuries per 1,000 fire incidents is 12. This indicator was the highest - 32 in 2015, and the lowest 0 in 2010. The trend for casualties per 1,000 incidents is growing. Compared to the Louisiana value the number of injuries per 1,000 fire incidents is much higher.
Based on the data from the years 2002 - 2018 the average number of fire-related casualties per year is 5. The highest number of injuries - 15 took place in 2015, and the lowest - 0 in 2010. The data has an increasing trend.
The average number of injuries per 1,000 fire incidents is 12. This indicator was the highest - 32 in 2015, and the lowest 0 in 2010. The trend for casualties per 1,000 incidents is growing. Compared to the Louisiana value the number of injuries per 1,000 fire incidents is much higher.Casualties per 1,000 incidents in Lafayette, LA compared to nearest cities:
(Note: Based on data for all years, including only cities with at least 500 fire incidents)
| Lafayette: | 13.5 |
| Scott: | 4.3 |
| Broussard: | 5.3 |
| Carencro: | 0.0 |
| Youngsville: | 3.6 |
| Breaux Bridge: | 1.8 |
| Duson: | 0.0 |
| Arnaudville: | 0.0 |
| Rayne: | 0.0 |
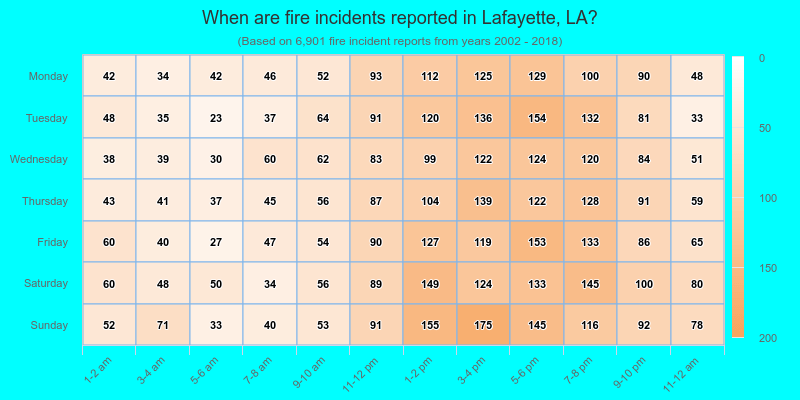
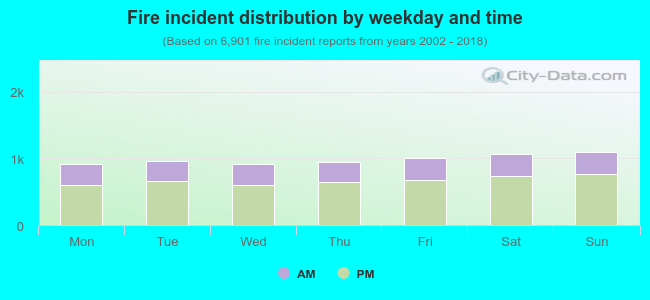 32.2% incidents where reported in the morning and 67.8% in the evening. The most fires (16.0%) took place on Sunday, and the least (13.2%) on Wednesday.
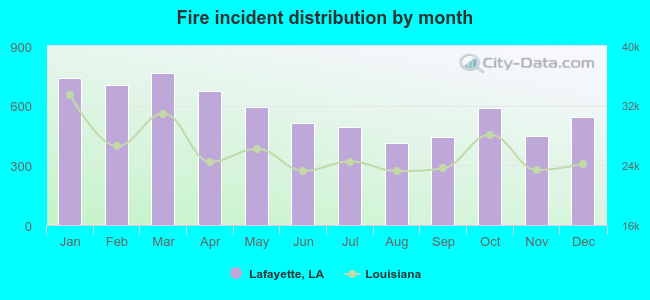 Based on the 6,901 fire incident reports from years 2002 - 2018 most fires (11.1%) took place during March, and the least (6.0%) in August.
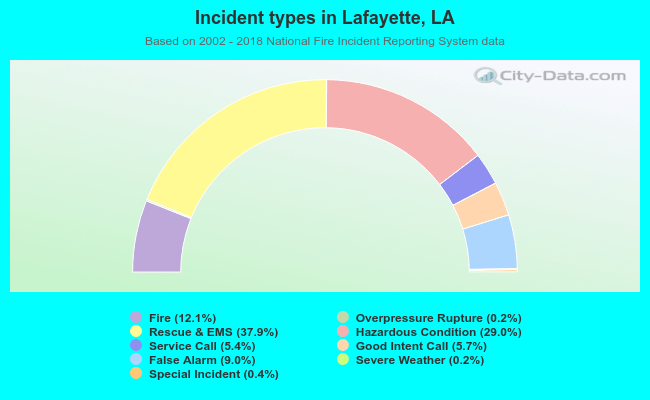 Out of all 57,053 cases reported during the years 2002 - 2018, the most belonged to the categories: Rescue & EMS (37.9%), Hazardous Condition (29.0%), and Fire (12.1%).
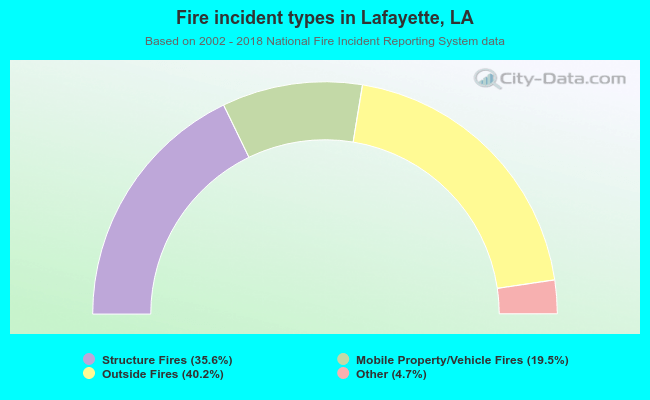 When looking into fire subcategories, the most incidents belonged to: Outside Fires (40.2%), and Structure Fires (35.6%).