Abilene: Fire Incidents, Kansas (KS)
Where are fire incidents reported in Abilene, KS
Something went wrong! Please refresh the page.
|
| |||||||||||||||||||||||||||||||||||||||||||||||||||||||||||||||||||||||||||||||||||||||||||||||||||||||||||||
2002 - 2018 National Fire Incident Reporting System (NFIRS) incidents
- Incident types reported to NFIRS in Abilene, KS
- 2,92954.8%Rescue & EMS
- 1,04519.6%Fire
- 84115.7%Hazardous Condition
- 2905.4%Good Intent Call
- 1262.4%False Alarm
- 521.0%Service Call
- 340.6%Severe Weather
- 220.4%Special Incident
- 60.1%Overpressure Rupture
- Fire incident types reported to NFIRS in Abilene, KS
- 57755.2%Outside Fires
- 34132.6%Structure Fires
- 11711.2%Mobile Property/Vehicle Fires
- 101.0%Other
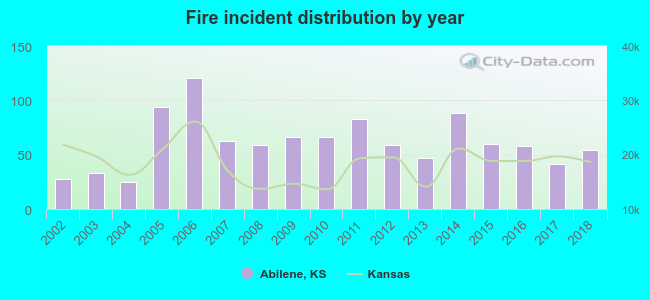 Based on the data from the years 2002 - 2018 the average number of fires per year is 61. The highest number of fire incidents - 121 took place in 2006, and the least - 25 in 2004. The data has a growing trend.
The average number of yearly fire incidents per 10k residents in Abilene, KS compared to nearest cities:
(Note: Based on data for the last 3 years, including only cities with population 5,000 and above)
| Abilene: | 77.4 |
| Junction City: | 70.4 |
| Salina: | 48.3 |
| Fort Riley: | 1.3 |
| Manhattan: | 44.4 |
| McPherson: | 61.2 |
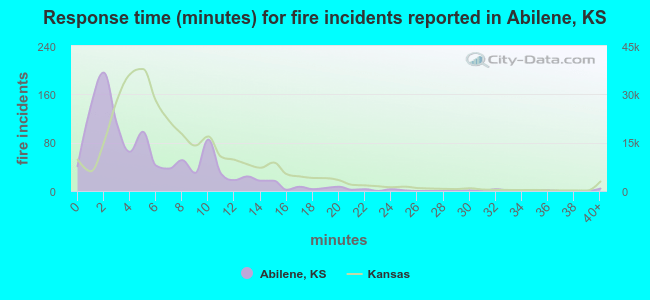 The median response time based on all reported fire incidents is 4 minutes. This is lower than the state median value.
The median response time in Abilene, KS compared to nearest cities:
(Note: Based on data for all years, including only cities with at least 500 fire incidents)
| Abilene: | 4 minutes |
| Junction City: | 4 minutes |
| Salina: | 4 minutes |
| Herington: | 9 minutes |
| Clay Center: | 6 minutes |
| Lindsborg: | 10 minutes |
| Manhattan: | 5 minutes |
| McPherson: | 5 minutes |
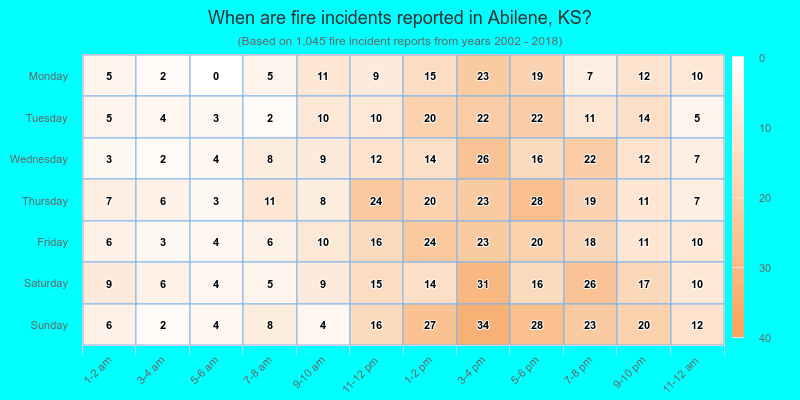
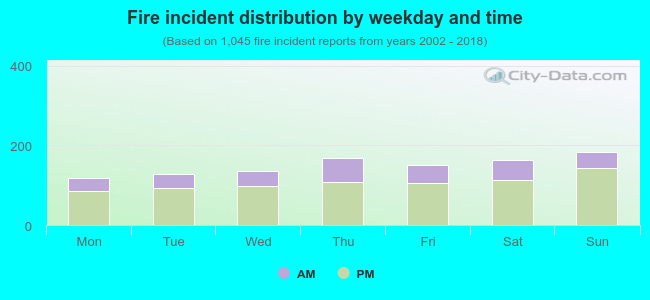 28.3% incidents where reported in the morning and 71.7% in the evening. The most fires (17.6%) took place on Sunday, and the least (11.3%) on Monday.
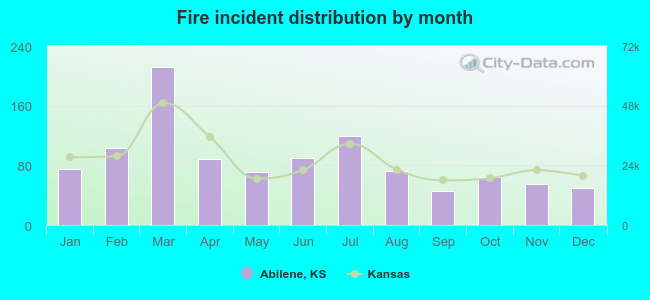 Based on the 1,045 fires from years 2002 - 2018 most fires (20.3%) took place during March, and the least (4.3%) in September.
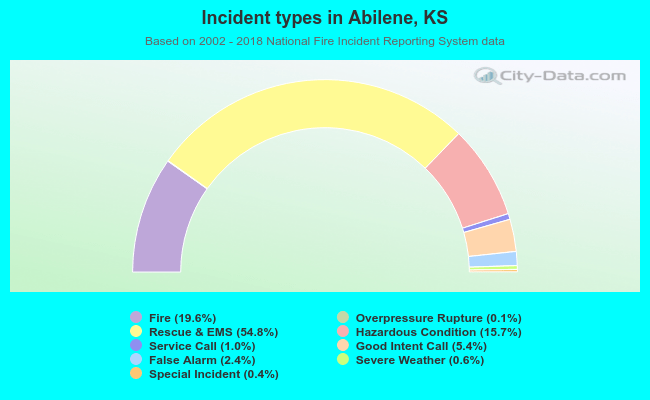 Out of all 5,345 cases reported during the years 2002 - 2018, the most belonged to the categories: Rescue & EMS (54.8%), Fire (19.6%), and Hazardous Condition (15.7%).
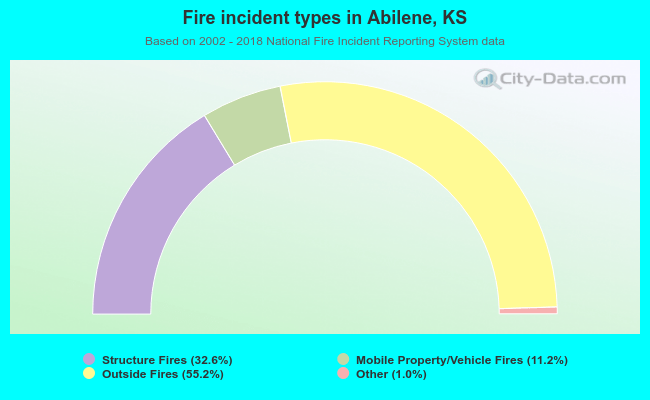 When looking into fire subcategories, the most reports belonged to: Outside Fires (55.2%), and Structure Fires (32.6%).