Salina: Fire Incidents, Kansas (KS)
Where are fire incidents reported in Salina, KS
Something went wrong! Please refresh the page.
| Fire incidents reported | |
|---|---|
| Sreet name | Count |
| 9TH ST | 424 |
| CRAWFORD ST | 292 |
| OHIO ST | 214 |
| 5TH ST | 124 |
| SANTA FE AVE | 114 |
| IRON AVE | 104 |
| 10TH ST | 102 |
| ASH ST | 102 |
| 12TH ST | 98 |
| CLOUD ST | 96 |
| BROADWAY BLVD | 86 |
| 2ND ST | 78 |
| STATE ST | 78 |
| 13TH ST | 76 |
| GYPSUM AVE | 70 |
| 11TH ST | 68 |
| 4TH ST | 68 |
| FAIRDALE RD | 64 |
| MAGNOLIA RD | 60 |
| 8TH ST | 58 |
| 3RD ST | 56 |
| 9TH | 56 |
| I-70 | 54 |
| I135 HWY | 54 |
| CHAPEL RIDGE PL | 52 |
| I70 | 50 |
| OHIO | 48 |
| SCHILLING RD | 48 |
| BURMA RD | 46 |
| FRONT ST | 46 |
| Other | 964 |
2002 - 2018 National Fire Incident Reporting System (NFIRS) incidents
- Incident types reported to NFIRS in Salina, KS
- 15,01157.5%Rescue & EMS
- 3,85014.7%Fire
- 2,85810.9%Hazardous Condition
- 1,7836.8%False Alarm
- 1,2794.9%Service Call
- 1,2324.7%Good Intent Call
- 810.3%Overpressure Rupture
- Fire incident types reported to NFIRS in Salina, KS
- 1,86948.5%Outside Fires
- 1,20031.2%Structure Fires
- 68717.8%Mobile Property/Vehicle Fires
- 942.4%Other
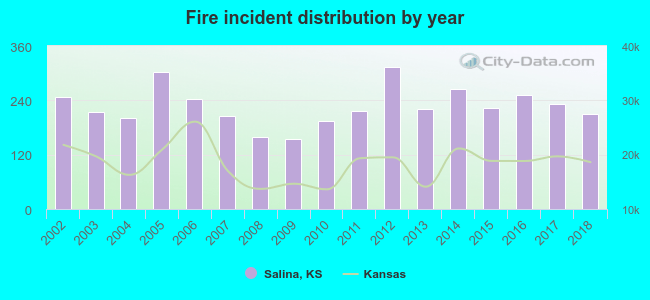 Based on the data from the years 2002 - 2018 the average number of fire incidents per year is 226. The highest number of reported fire incidents - 314 took place in 2012, and the least - 154 in 2009. The data has a decreasing trend.
The average number of yearly fire incidents per 10k residents in Salina, KS compared to nearest cities:
(Note: Based on data for the last 3 years, including only cities with population 5,000 and above)
| Salina: | 48.3 |
| Abilene: | 77.4 |
| McPherson: | 61.2 |
| Junction City: | 70.4 |
| Fort Riley: | 1.3 |
| Concordia: | 61.5 |
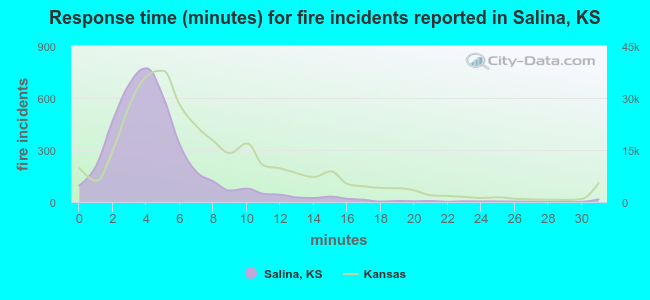 The median response time based on all reported fire incidents is 4 minutes. This is lower compared to the Kansas median value.
The median response time in Salina, KS compared to nearest cities:
(Note: Based on data for all years, including only cities with at least 500 fire incidents)
| Salina: | 4 minutes |
| Lindsborg: | 10 minutes |
| Abilene: | 4 minutes |
| McPherson: | 5 minutes |
| Ellsworth: | 8 minutes |
| Herington: | 9 minutes |
| Inman: | 10 minutes |
| Junction City: | 4 minutes |
| Clay Center: | 6 minutes |
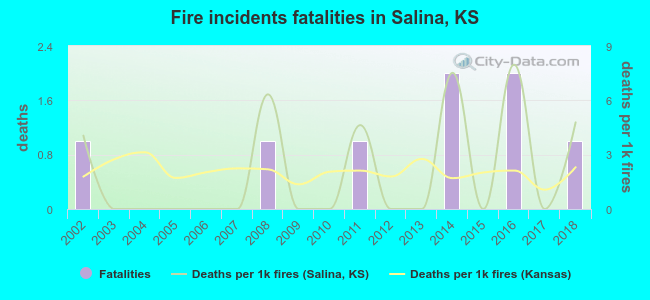 Based on the reports from the years 2002 - 2018 the average number of fire-related yearly deaths is 0. The highest number of deaths - 2 took place in 2014, and the lowest - 0 in 2003. The data has a constant trend.
The average number of deaths per 1,000 fire incidents is 2. This indicator was the highest - 8 in 2016, and the lowest 0 in 2003. The trend for deaths per 1,000 fire incidents is rising. Compared to the state value the number of fatalities per 1,000 fires is about the same.
Based on the reports from the years 2002 - 2018 the average number of fire-related yearly deaths is 0. The highest number of deaths - 2 took place in 2014, and the lowest - 0 in 2003. The data has a constant trend.
The average number of deaths per 1,000 fire incidents is 2. This indicator was the highest - 8 in 2016, and the lowest 0 in 2003. The trend for deaths per 1,000 fire incidents is rising. Compared to the state value the number of fatalities per 1,000 fires is about the same.Deaths per 1,000 incidents in Salina, KS compared to nearest cities:
(Note: Based on data for all years, including only cities with at least 2,500 fire incidents)
| Salina: | 2.1 |
| Junction City: | 2.8 |
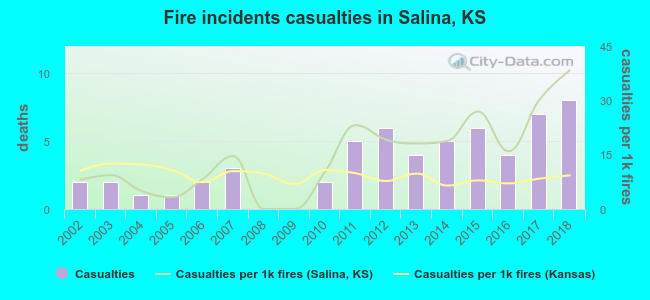 Based on the data from the years 2002 - 2018 the average number of fire-related yearly casualties is 3. The highest number of injuries - 8 took place in 2018, and the lowest - 0 in 2008. The data has an increasing trend.
The average number of casualties per 1,000 fires is 15. This indicator was the highest - 38 in 2018, and the lowest 0 in 2008. The trend for injuries per 1,000 incidents is rising. Compared to the state value the number of injuries per 1,000 incidents is higher.
Based on the data from the years 2002 - 2018 the average number of fire-related yearly casualties is 3. The highest number of injuries - 8 took place in 2018, and the lowest - 0 in 2008. The data has an increasing trend.
The average number of casualties per 1,000 fires is 15. This indicator was the highest - 38 in 2018, and the lowest 0 in 2008. The trend for injuries per 1,000 incidents is rising. Compared to the state value the number of injuries per 1,000 incidents is higher.Casualties per 1,000 incidents in Salina, KS compared to nearest cities:
(Note: Based on data for all years, including only cities with at least 500 fire incidents)
| Salina: | 15.1 |
| Lindsborg: | 0.0 |
| Abilene: | 1.0 |
| McPherson: | 11.7 |
| Ellsworth: | 0.0 |
| Herington: | 3.4 |
| Inman: | 0.0 |
| Junction City: | 15.9 |
| Clay Center: | 7.5 |
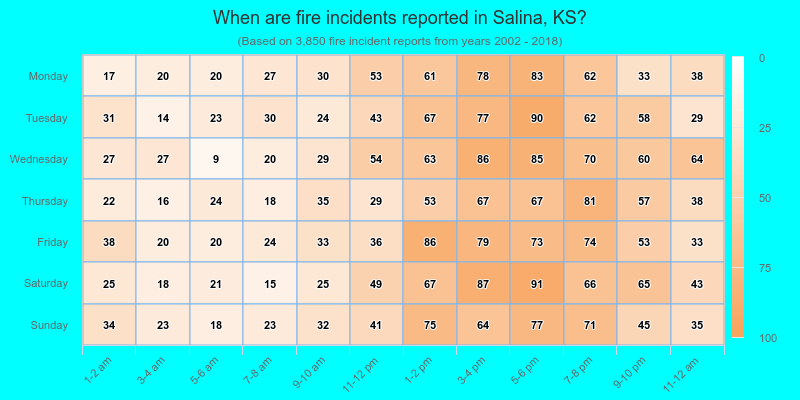
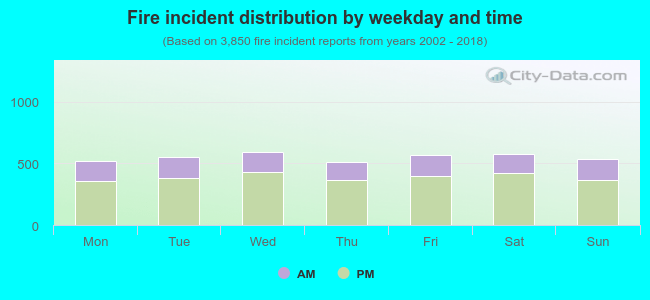 29.5% incidents where reported in the morning and 70.5% in the evening. The most fires (15.4%) took place on Wednesday, and the least (13.2%) on Thursday.
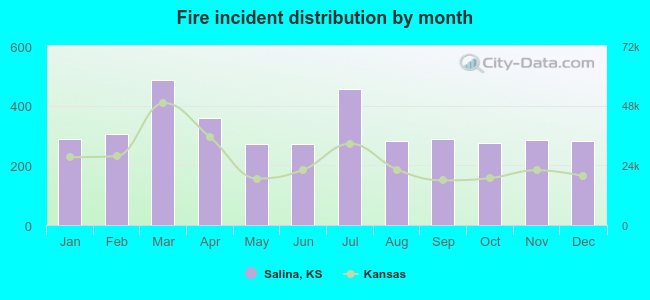 According to the 3,850 fires from years 2002 - 2018 most fires (12.6%) took place during March, and the least (7.0%) in May.
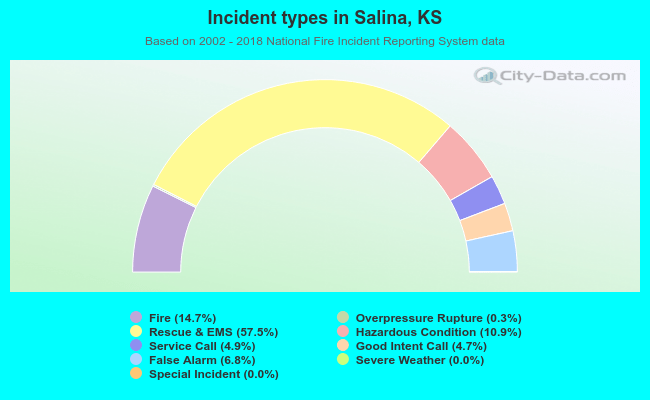 Out of all 26,107 cases reported during the years 2002 - 2018, the most belonged to the categories: Rescue & EMS (57.5%), Fire (14.7%), and Hazardous Condition (10.9%).
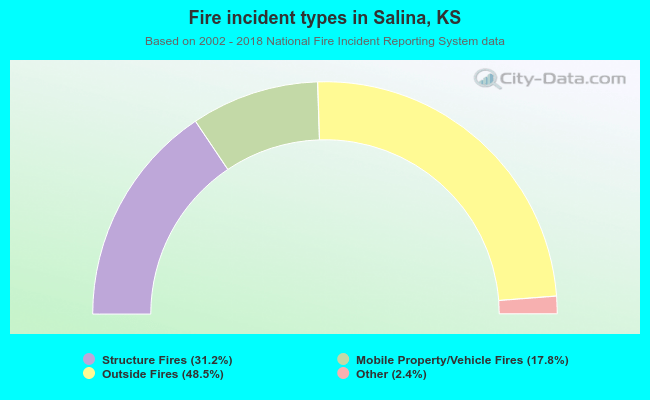 When looking into fire subcategories, the most incidents belonged to: Outside Fires (48.5%), and Structure Fires (31.2%).