Alameda: Fire Incidents, California (CA)
Where are fire incidents reported in Alameda, CA
Something went wrong! Please refresh the page.
| Fire incidents reported | |
|---|---|
| Sreet name | Count |
| SHORELINE DR | 102 |
| CENTRAL AV | 96 |
| BUENA VISTA AV | 80 |
| PARK ST | 80 |
| GRAND ST | 72 |
| BUENA VISTA | 62 |
| LINCOLN AV | 60 |
| SANTA CLARA AV | 56 |
| CENTRAL | 54 |
| WEBSTER ST | 54 |
| PACIFIC AV | 52 |
| ENCINAL AV | 36 |
| OTIS DR | 36 |
| SANTA CLARA | 34 |
| SHORELINE DR | 32 |
| WILLOW ST | 32 |
| CYPRESS ST | 30 |
| LINCOLN | 30 |
| SHOREPOINT CT | 30 |
| MAIN ST | 28 |
| POGGI ST | 28 |
| REGENT ST | 28 |
| WESTLINE DR | 28 |
| BROADWAY | 26 |
| LOOP RD | 26 |
| WEBSTER ST | 26 |
| BARBERS POINT RD | 24 |
| ENCINAL | 24 |
| CORPUS CHRISTI RD | 22 |
| HARBOR BAY PW | 22 |
| Other | 419 |
2005 - 2018 National Fire Incident Reporting System (NFIRS) incidents
- Incident types reported to NFIRS in Alameda, CA
- 19,20265.7%Rescue & EMS
- 3,07710.5%Good Intent Call
- 2,0427.0%False Alarm
- 1,7996.2%Service Call
- 1,7295.9%Fire
- 1,3274.5%Hazardous Condition
- Fire incident types reported to NFIRS in Alameda, CA
- 93053.8%Structure Fires
- 57633.3%Outside Fires
- 1679.7%Mobile Property/Vehicle Fires
- 563.2%Other
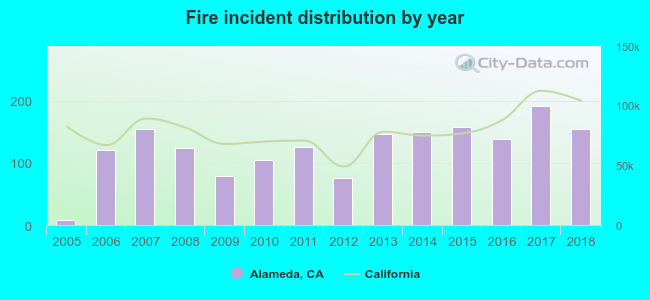 Based on the data from the years 2005 - 2018 the average number of fire incidents per year is 123. The highest number of reported fires - 192 took place in 2017, and the least - 8 in 2005. The data has a rising trend.
The average number of yearly fire incidents per 10k residents in Alameda, CA compared to nearest cities:
(Note: Based on data for the last 3 years, including only cities with population 5,000 and above)
| Alameda: | 20.8 |
| Oakland: | 37.6 |
| Piedmont: | 10.7 |
| Emeryville: | 46.3 |
| San Leandro: | 33.1 |
| Berkeley: | 22.9 |
| Albany: | 19.3 |
| Moraga: | 14.9 |
| San Lorenzo: | 27.3 |
 The median response time based on all reported fire incidents is 4 minutes. This is lower than the state median value.
The median response time in Alameda, CA compared to nearest cities:
(Note: Based on data for all years, including only cities with at least 500 fire incidents)
| Alameda: | 4 minutes |
| Oakland: | 5 minutes |
| San Leandro: | 4 minutes |
| Berkeley: | 5 minutes |
| Albany: | 4 minutes |
| San Lorenzo: | 4 minutes |
| Brisbane: | 5 minutes |
| San Francisco: | 4 minutes |
| Castro Valley: | 5 minutes |
 Based on the data from the years 2005 - 2018 the average number of fire-related yearly casualties is 0. The highest number of reported casualties - 2 took place in 2008, and the lowest - 0 in 2005. The data has a constant trend.
The average number of casualties per 1,000 fires is 2. This indicator was the highest - 16 in 2008, and the lowest 0 in 2005. The trend for injuries per 1,000 fire incidents is constant. Compared to the California value the number of injuries per 1,000 incidents is much lower.
Based on the data from the years 2005 - 2018 the average number of fire-related yearly casualties is 0. The highest number of reported casualties - 2 took place in 2008, and the lowest - 0 in 2005. The data has a constant trend.
The average number of casualties per 1,000 fires is 2. This indicator was the highest - 16 in 2008, and the lowest 0 in 2005. The trend for injuries per 1,000 fire incidents is constant. Compared to the California value the number of injuries per 1,000 incidents is much lower.Casualties per 1,000 incidents in Alameda, CA compared to nearest cities:
(Note: Based on data for all years, including only cities with at least 500 fire incidents)
| Alameda: | 2.3 |
| Oakland: | 1.5 |
| San Leandro: | 2.8 |
| Berkeley: | 7.1 |
| Albany: | 1.6 |
| San Lorenzo: | 0.0 |
| Brisbane: | 2.9 |
| San Francisco: | 5.9 |
| Castro Valley: | 0.9 |
 29.9% incidents where reported in the morning and 70.1% in the evening. The most fires (16.1%) took place on Sunday, and the least (13.3%) on Friday.
 Based on the 1,729 reports from years 2005 - 2018 most fires (12.3%) took place during July, and the least (5.7%) in November.
 Out of all 29,213 cases reported during the years 2005 - 2018, the most belonged to the categories: Rescue & EMS (65.7%), Good Intent Call (10.5%), and False Alarm (7.0%).
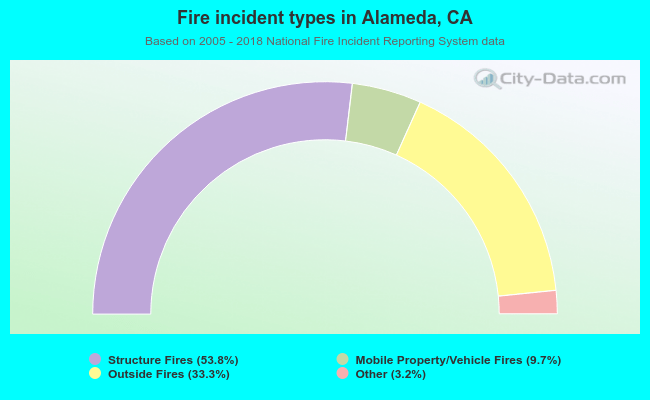 When looking into fire subcategories, the most incidents belonged to: Structure Fires (53.8%), and Outside Fires (33.3%).