Oakland: Fire Incidents, California (CA)
Where are fire incidents reported in Oakland, CA
Something went wrong! Please refresh the page.
| Fire incidents reported | |
|---|---|
| Sreet name | Count |
| 12TH ST | 624 |
| 7TH ST | 420 |
| MACARTHUR BLVD | 416 |
| ST | 334 |
| AV | 292 |
| GRAND AVE | 286 |
| 34TH ST | 272 |
| HIGH ST | 258 |
| 8TH ST | 248 |
| INTERNATIONAL BLVD | 236 |
| BROADWAY | 226 |
| 14TH ST | 224 |
| 17TH ST | 220 |
| BANCROFT AVE | 220 |
| 10TH ST | 214 |
| FRUITVALE AVE | 210 |
| FOOTHILL BLVD | 208 |
| SAN LEANDRO ST | 186 |
| 27TH ST | 178 |
| SAN PABLO AVE | 174 |
| 9TH ST | 166 |
| 18TH ST | 158 |
| 5TH ST | 158 |
| 24TH ST | 150 |
| 15TH ST | 148 |
| 16TH ST | 138 |
| 73RD AVE | 138 |
| 11TH ST | 136 |
| 98TH AV | 130 |
| 21ST ST | 128 |
| Other | 5,217 |
2005 - 2018 National Fire Incident Reporting System (NFIRS) incidents
- Incident types reported to NFIRS in Oakland, CA
- 127,44666.4%Rescue & EMS
- 30,79016.0%Good Intent Call
- 12,1136.3%Fire
- 9,2184.8%False Alarm
- 7,0463.7%Hazardous Condition
- 5,0962.7%Service Call
- 2340.1%Special Incident
- Fire incident types reported to NFIRS in Oakland, CA
- 4,85040.0%Outside Fires
- 3,60529.8%Structure Fires
- 3,25326.9%Mobile Property/Vehicle Fires
- 4053.3%Other
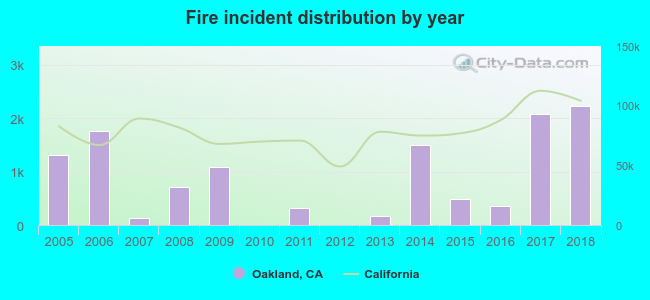 Based on the data from the years 2005 - 2018 the average number of fire incidents per year is 865. The highest number of reported fire incidents - 2,233 took place in 2018, and the least - 2 in 2012. The data has a rising trend.
The average number of yearly fire incidents per 10k residents in Oakland, CA compared to nearest cities:
(Note: Based on data for the last 3 years, including only cities with population 5,000 and above)
| Oakland: | 37.6 |
| Piedmont: | 10.7 |
| Alameda: | 20.8 |
| Emeryville: | 46.3 |
| Berkeley: | 22.9 |
| Moraga: | 14.9 |
| Orinda: | 26.1 |
| San Leandro: | 33.1 |
| Albany: | 19.3 |
 The median response time based on all reported fire incidents is 5 minutes. This is lower compared to the California median value.
The median response time in Oakland, CA compared to nearest cities:
(Note: Based on data for all years, including only cities with at least 500 fire incidents)
| Oakland: | 5 minutes |
| Alameda: | 4 minutes |
| Berkeley: | 5 minutes |
| San Leandro: | 4 minutes |
| Albany: | 4 minutes |
| Lafayette: | 7 minutes |
| El Cerrito: | 6 minutes |
| San Lorenzo: | 4 minutes |
| Castro Valley: | 5 minutes |
 Based on the reports from the years 2005 - 2018 the average number of fire-related fatalities per year is 4. The highest number of deaths - 35 took place in 2016, and the lowest - 0 in 2007. The data has a constant trend.
The average number of fatalities per 1,000 fire incidents is 9. This indicator was the highest - 98 in 2016, and the lowest 0 in 2007. The trend for fatalities per 1,000 fire incidents is declining. Compared to the California value the number of fatalities per 1,000 incidents is much higher.
Based on the reports from the years 2005 - 2018 the average number of fire-related fatalities per year is 4. The highest number of deaths - 35 took place in 2016, and the lowest - 0 in 2007. The data has a constant trend.
The average number of fatalities per 1,000 fire incidents is 9. This indicator was the highest - 98 in 2016, and the lowest 0 in 2007. The trend for fatalities per 1,000 fire incidents is declining. Compared to the California value the number of fatalities per 1,000 incidents is much higher.Deaths per 1,000 incidents in Oakland, CA compared to nearest cities:
(Note: Based on data for all years, including only cities with at least 2,500 fire incidents)
| Oakland: | 4.7 |
| Berkeley: | 2.0 |
| San Leandro: | 2.4 |
| Richmond: | 1.9 |
| San Francisco: | 1.3 |
| Concord: | 1.2 |
| San Mateo: | 0.7 |
 According to the reports from the years 2005 - 2018 the average number of fire-related yearly casualties is 1. The highest number of casualties - 4 took place in 2005, and the lowest - 0 in 2007. The data has a dropping trend.
The average number of injuries per 1,000 fire incidents is 1. This indicator was the highest - 4 in 2015, and the lowest 0 in 2007. The trend for injuries per 1,000 incidents is declining. Compared to the state value the number of injuries per 1,000 fire incidents is much lower.
According to the reports from the years 2005 - 2018 the average number of fire-related yearly casualties is 1. The highest number of casualties - 4 took place in 2005, and the lowest - 0 in 2007. The data has a dropping trend.
The average number of injuries per 1,000 fire incidents is 1. This indicator was the highest - 4 in 2015, and the lowest 0 in 2007. The trend for injuries per 1,000 incidents is declining. Compared to the state value the number of injuries per 1,000 fire incidents is much lower.Casualties per 1,000 incidents in Oakland, CA compared to nearest cities:
(Note: Based on data for all years, including only cities with at least 500 fire incidents)
| Oakland: | 1.5 |
| Alameda: | 2.3 |
| Berkeley: | 7.1 |
| San Leandro: | 2.8 |
| Albany: | 1.6 |
| Lafayette: | 1.9 |
| El Cerrito: | 1.3 |
| San Lorenzo: | 0.0 |
| Castro Valley: | 0.9 |
 39.4% incidents where reported in the morning and 60.6% in the evening. The most fires (15.4%) took place on Sunday, and the least (13.6%) on Wednesday.
 According to the 12,113 fire incident reports from years 2005 - 2018 most fires (11.0%) took place during July, and the least (7.2%) in April.
 Out of all 192,046 cases reported during the years 2005 - 2018, the most belonged to the categories: Rescue & EMS (66.4%), Good Intent Call (16.0%), and Fire (6.3%).
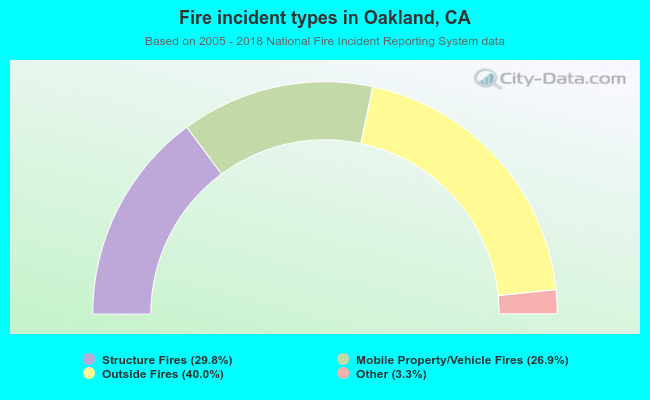 When looking into fire subcategories, the most reports belonged to: Outside Fires (40.0%), and Structure Fires (29.8%).