Alamo: Fire Incidents, Texas (TX)
Where are fire incidents reported in Alamo, TX
Something went wrong! Please refresh the page.
| Fire incidents reported | |
|---|---|
| Sreet name | Count |
| ALAMO RD | 336 |
| TOWER RD | 246 |
| FRONTAGE RD | 184 |
| SIOUX RD | 126 |
| BORDER RD | 94 |
| BUSINESS 83 HWY | 78 |
| TOWER | 68 |
| TOWER RD | 64 |
| ALAMO RD | 56 |
| OWASSA RD | 54 |
| CESAR CHAVEZ RD | 50 |
| FRONTAGE | 48 |
| FM 495 | 44 |
| MOORE RD | 40 |
| RANCHO BLANCO RD | 40 |
| RIDGE RD | 38 |
| CESAR CHAVEZ | 36 |
| DURANTA AVE | 36 |
| EL GATO RD | 36 |
| OWASSA | 36 |
| 7TH ST | 34 |
| ELDORA RD | 32 |
| ACACIA AVE | 30 |
| MINNESOTA RD | 30 |
| WHALEN RD | 30 |
| BORDER RD | 28 |
| CHEROKEE LN | 28 |
| EXPRESSWAY 83 | 26 |
| ANACUA CIR | 24 |
| BOWIE AVE | 24 |
| Other | 538 |
2002 - 2018 National Fire Incident Reporting System (NFIRS) incidents
- Incident types reported to NFIRS in Alamo, TX
- 2,53426.4%Fire
- 2,52626.3%Service Call
- 2,18622.8%Hazardous Condition
- 1,68817.6%Rescue & EMS
- 4885.1%False Alarm
- 1641.7%Good Intent Call
- Fire incident types reported to NFIRS in Alamo, TX
- 1,64064.7%Outside Fires
- 39515.6%Mobile Property/Vehicle Fires
- 36214.3%Structure Fires
- 1375.4%Other
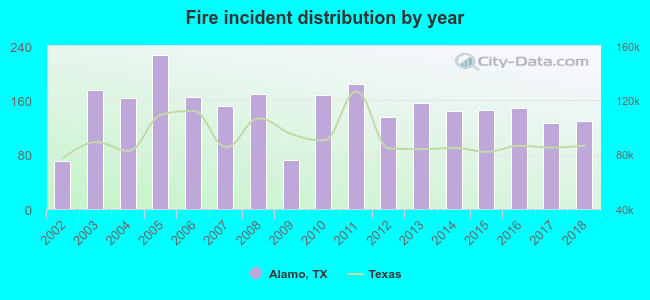 Based on the data from the years 2002 - 2018 the average number of fire incidents per year is 149. The highest number of reported fire incidents - 227 took place in 2005, and the least - 71 in 2002. The data has an increasing trend.
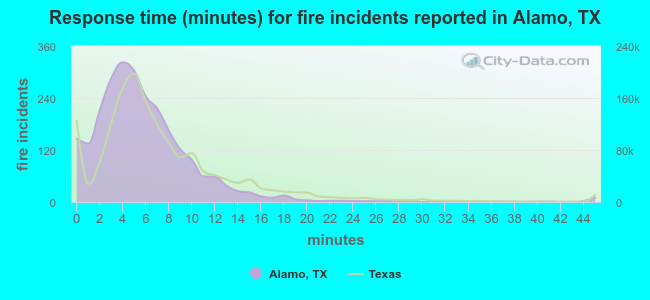 The median response time based on all reported fire incidents is 5 minutes. This is lower compared to the state median value.
The median response time in Alamo, TX compared to nearest cities:
(Note: Based on data for all years, including only cities with at least 500 fire incidents)
| Alamo: | 5 minutes |
| San Juan: | 5 minutes |
| Pharr: | 4 minutes |
| McAllen: | 5 minutes |
| Weslaco: | 7 minutes |
| Edinburg: | 7 minutes |
| Elsa: | 5 minutes |
| Mercedes: | 9 minutes |
| Mission: | 6 minutes |
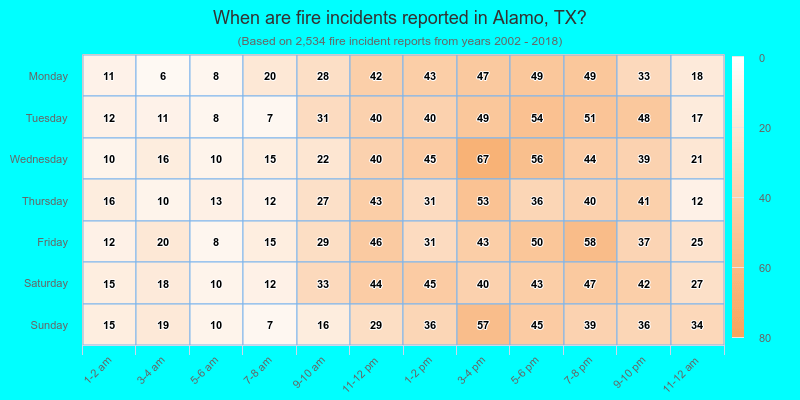
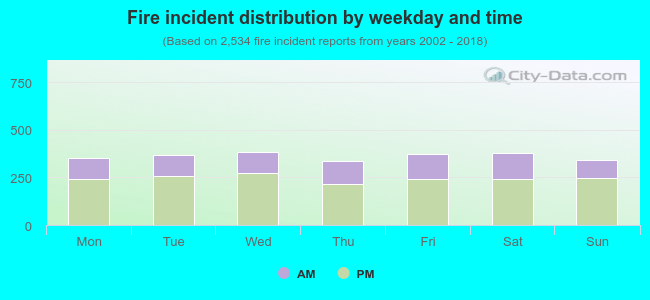 32.2% incidents where reported in the morning and 67.8% in the evening. The most fires (15.2%) took place on Wednesday, and the least (13.2%) on Thursday.
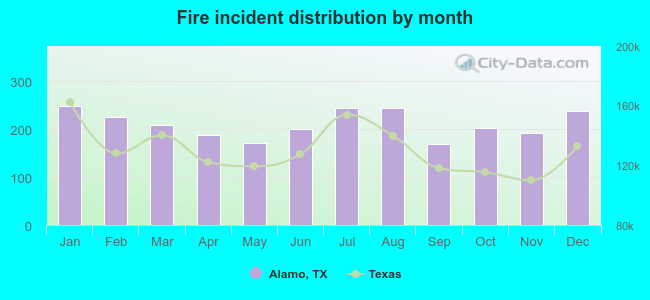 Based on the 2,534 fire incident reports from years 2002 - 2018 most fires (9.8%) took place during January, and the least (6.6%) in September.
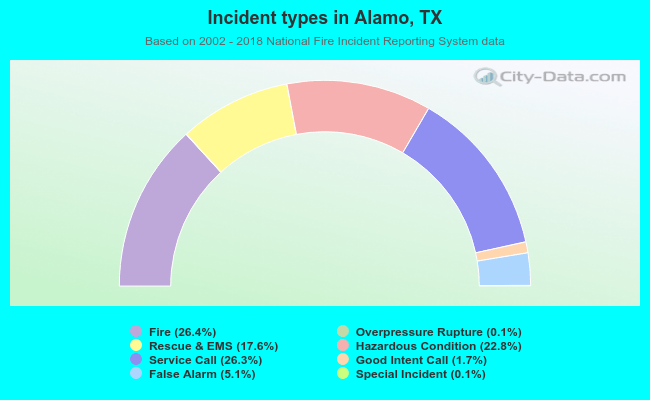 Out of all 9,601 cases reported during the years 2002 - 2018, the most belonged to the categories: Fire (26.4%), Service Call (26.3%), and Hazardous Condition (22.8%).
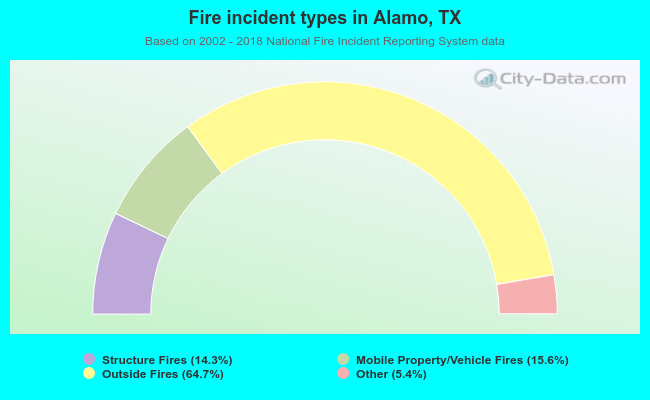 When looking into fire subcategories, the most incidents belonged to: Outside Fires (64.7%), and Mobile Property/Vehicle Fires (15.6%).