Mission: Fire Incidents, Texas (TX)
Where are fire incidents reported in Mission, TX
Something went wrong! Please refresh the page.
| Fire incidents reported | |
|---|---|
| Sreet name | Count |
| EXPRESSWAY 83 | 184 |
| SHARY RD | 152 |
| CONWAY AVE | 136 |
| CONWAY | 126 |
| INSPIRATION RD | 90 |
| BRYAN RD | 78 |
| EXPRESSWAY 83 HWY | 74 |
| LOS EBANOS RD | 68 |
| TAYLOR RD | 66 |
| GLASSCOCK | 54 |
| 3 MILE LINE | 52 |
| LOS EBANOS | 52 |
| MOOREFIELD RD | 52 |
| TROSPER | 50 |
| BENTSEN PALM DR | 48 |
| SHARY | 48 |
| MOOREFIELD | 42 |
| INSPIRATION | 38 |
| LA HOMA RD | 38 |
| BUSINESS 83 | 36 |
| EXPRESSWAY 83 EXPY | 36 |
| 4 MILE LINE | 34 |
| GRIFFIN PARKWAY | 34 |
| GRIFFIN PKY | 34 |
| MAYBERRY RD | 34 |
| MILITARY RD | 34 |
| STEWART RD | 34 |
| TROSPER RD | 34 |
| MELBA CARTER | 32 |
| 3 MILE LINE RD | 30 |
| Other | 3,081 |
2002 - 2018 National Fire Incident Reporting System (NFIRS) incidents
- Incident types reported to NFIRS in Mission, TX
- 7,44032.7%Rescue & EMS
- 4,90121.6%Fire
- 2,97713.1%Hazardous Condition
- 2,86612.6%Good Intent Call
- 2,75912.1%Service Call
- 1,6637.3%False Alarm
- 580.3%Overpressure Rupture
- 470.2%Special Incident
- Fire incident types reported to NFIRS in Mission, TX
- 3,00561.3%Outside Fires
- 93719.1%Structure Fires
- 76815.7%Mobile Property/Vehicle Fires
- 1913.9%Other
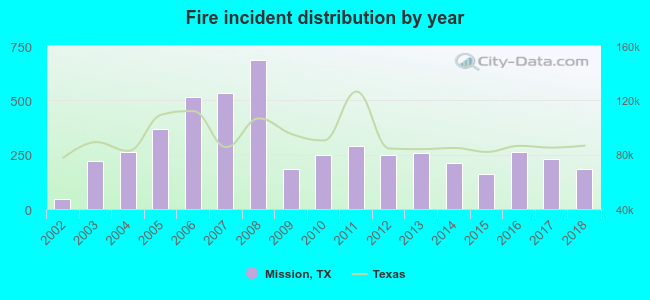 Based on the data from the years 2002 - 2018 the average number of fire incidents per year is 288. The highest number of reported fire incidents - 684 took place in 2008, and the least - 47 in 2002. The data has an increasing trend.
The average number of yearly fire incidents per 10k residents in Mission, TX compared to nearest cities:
(Note: Based on data for the last 3 years, including only cities with population 5,000 and above)
| Mission: | 27.3 |
| Palmview: | 88.9 |
| Alton: | 7.3 |
| McAllen: | 22.8 |
| Pharr: | 4.1 |
| Hidalgo: | 2.0 |
| San Juan: | 19.7 |
| Edinburg: | 37.3 |
| Alamo: | 70.4 |
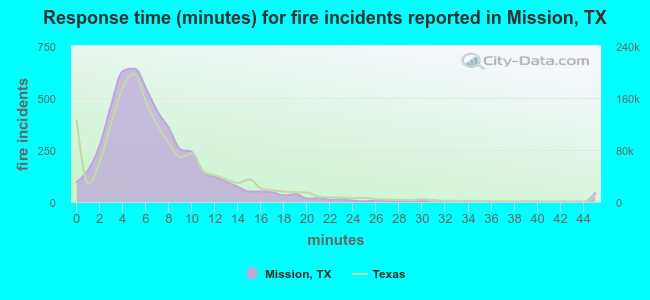 The median response time based on all reported fire incidents is 6 minutes. This is similar to the state median value.
The median response time in Mission, TX compared to nearest cities:
(Note: Based on data for all years, including only cities with at least 500 fire incidents)
| Mission: | 6 minutes |
| Palmview: | 6 minutes |
| McAllen: | 5 minutes |
| Pharr: | 4 minutes |
| San Juan: | 5 minutes |
| Edinburg: | 7 minutes |
| Alamo: | 5 minutes |
| Weslaco: | 7 minutes |
| Elsa: | 5 minutes |
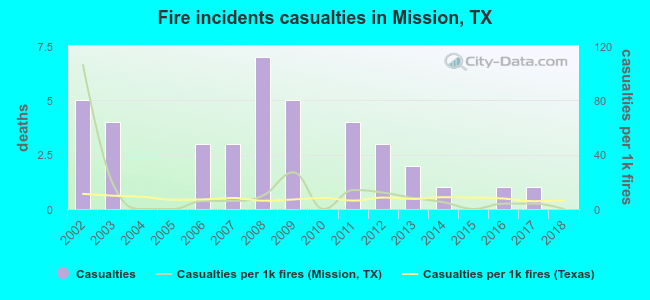 According to the reports from the years 2002 - 2018 the average number of fire-related casualties per year is 2. The highest number of injuries - 7 took place in 2008, and the lowest - 0 in 2004. The data has a dropping trend.
The average number of casualties per 1,000 fire incidents is 13. This indicator was the highest - 106 in 2002, and the lowest 0 in 2004. The trend for casualties per 1,000 fires is decreasing. Compared to the state value the number of casualties per 1,000 fire incidents is similar.
According to the reports from the years 2002 - 2018 the average number of fire-related casualties per year is 2. The highest number of injuries - 7 took place in 2008, and the lowest - 0 in 2004. The data has a dropping trend.
The average number of casualties per 1,000 fire incidents is 13. This indicator was the highest - 106 in 2002, and the lowest 0 in 2004. The trend for casualties per 1,000 fires is decreasing. Compared to the state value the number of casualties per 1,000 fire incidents is similar.
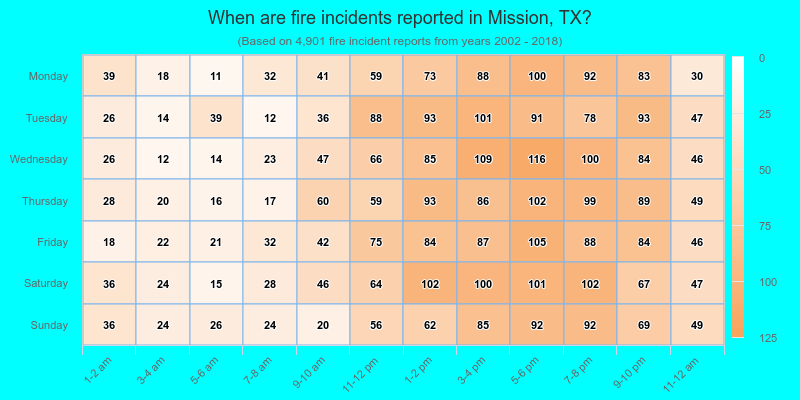
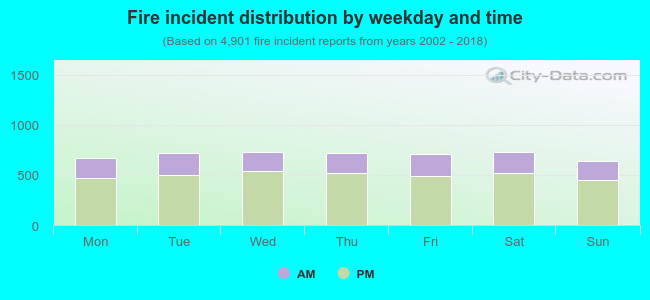 28.8% incidents where reported in the morning and 71.2% in the evening. The most fires (14.9%) took place on Saturday, and the least (13.0%) on Sunday.
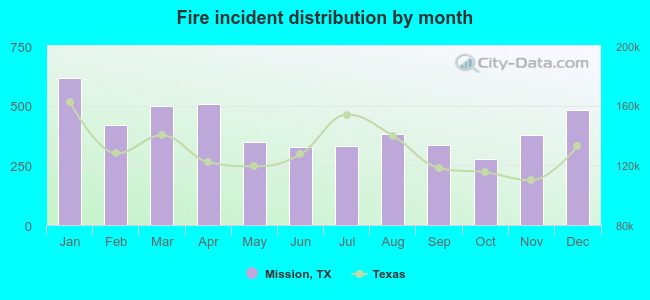 Based on the 4,901 fire incident reports from years 2002 - 2018 most fires (12.5%) took place during January, and the least (5.7%) in October.
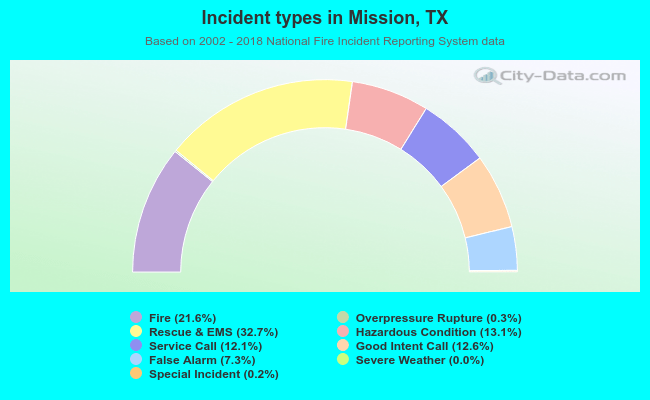 Out of all 22,721 cases reported during the years 2002 - 2018, the most belonged to the categories: Rescue & EMS (32.7%), Fire (21.6%), and Hazardous Condition (13.1%).
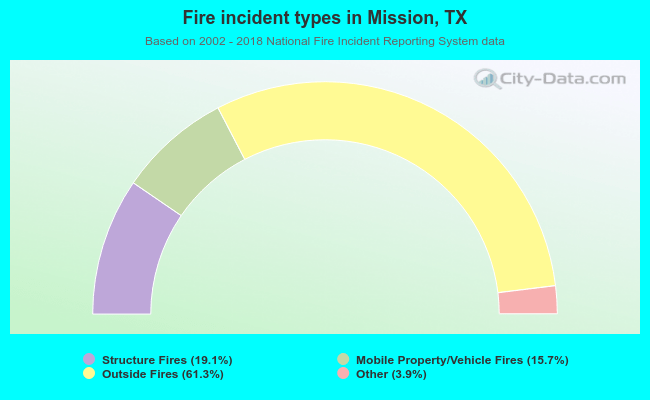 When looking into fire subcategories, the most reports belonged to: Outside Fires (61.3%), and Structure Fires (19.1%).