Algona: Fire Incidents, Iowa (IA)
Where are fire incidents reported in Algona, IA
Something went wrong! Please refresh the page.
|
| |||||||||||||||||||||||||||||||||||||||||||||||||||||||||||||||||||||||||||||||||||||||||||||||||||||||||||||
2003 - 2017 National Fire Incident Reporting System (NFIRS) incidents
- Incident types reported to NFIRS in Algona, IA
- 30966.5%Fire
- 6413.8%Hazardous Condition
- 459.7%Rescue & EMS
- 163.4%Service Call
- 112.4%Good Intent Call
- 112.4%False Alarm
- 61.3%Severe Weather
- 20.4%Special Incident
- 10.2%Overpressure Rupture
- Fire incident types reported to NFIRS in Algona, IA
- 13443.4%Outside Fires
- 11035.6%Structure Fires
- 6119.7%Mobile Property/Vehicle Fires
- 41.3%Other
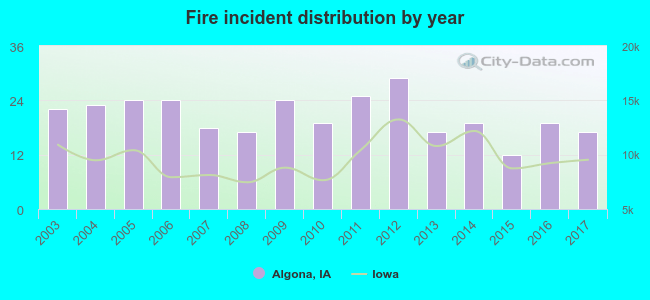 Based on the data from the years 2003 - 2017 the average number of fires per year is 21. The highest number of reported fire incidents - 29 took place in 2012, and the least - 12 in 2015. The data has a declining trend.
The average number of yearly fire incidents per 10k residents in Algona, IA compared to nearest cities:
(Note: Based on data for the last 3 years, including only cities with population 5,000 and above)
| Algona: | 32.9 |
| Estherville: | 24.5 |
| Fort Dodge: | 29.1 |

 29.1% incidents where reported in the morning and 70.9% in the evening. The most fires (16.5%) took place on Friday, and the least (10.0%) on Thursday.
 According to the 309 fire incident reports from years 2003 - 2017 most fires (17.5%) took place during April, and the least (4.5%) in January.
 Out of all 465 cases reported during the years 2003 - 2017, the most belonged to the categories: Fire (66.5%), Hazardous Condition (13.8%), and Rescue & EMS (9.7%).
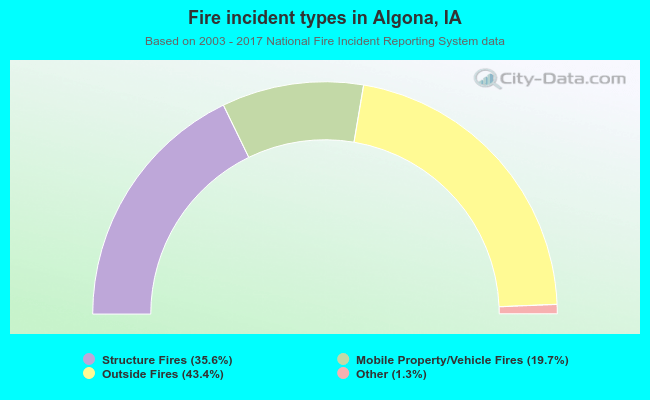 When looking into fire subcategories, the most incidents belonged to: Outside Fires (43.4%), and Structure Fires (35.6%).