Allen: Fire Incidents, Texas (TX)
Where are fire incidents reported in Allen, TX
Something went wrong! Please refresh the page.
| Fire incidents reported | |
|---|---|
| Sreet name | Count |
| GREENVILLE AVE | 180 |
| STACY RD | 162 |
| BETHANY DR | 154 |
| MCDERMOTT DR | 132 |
| JUPITER RD | 106 |
| US75 | 84 |
| MAIN ST | 78 |
| GREENVILLE AV | 68 |
| CENTRAL EXPWY | 58 |
| CHAPARRAL RD | 54 |
| CENTRAL EXPY | 50 |
| RIVERCREST BLVD | 48 |
| EXCHANGE PKY | 46 |
| CENTRAL EXPWY HWY | 42 |
| BENTON DR | 32 |
| SH121 | 32 |
| VALLEY VIEW DR | 32 |
| COTTONWOOD DR | 30 |
| WATTERS RD | 30 |
| EXCHANGE PKWY | 26 |
| RIDGEMONT DR | 26 |
| ELLIS DR | 24 |
| SUNNY SLOPE DR | 24 |
| MEADOW MEAD DR | 22 |
| PARK PLACE DR | 22 |
| BRAY CENTRAL DR | 20 |
| CENTRAL SERV | 20 |
| CUSTER RD | 20 |
| SERVICE RD | 20 |
| ALDER DR | 18 |
| Other | 591 |
2003 - 2018 National Fire Incident Reporting System (NFIRS) incidents
- Incident types reported to NFIRS in Allen, TX
- 16,64757.0%Rescue & EMS
- 3,28311.2%False Alarm
- 3,10910.6%Hazardous Condition
- 2,2517.7%Fire
- 2,0417.0%Service Call
- 1,8146.2%Good Intent Call
- Fire incident types reported to NFIRS in Allen, TX
- 88839.4%Outside Fires
- 86538.4%Structure Fires
- 34315.2%Mobile Property/Vehicle Fires
- 1556.9%Other
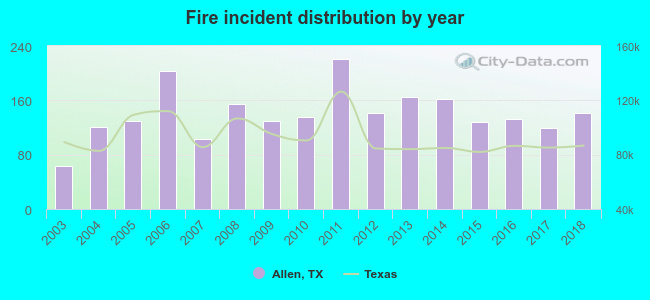 Based on the data from the years 2003 - 2018 the average number of fire incidents per year is 141. The highest number of fires - 221 took place in 2011, and the least - 63 in 2003. The data has a rising trend.
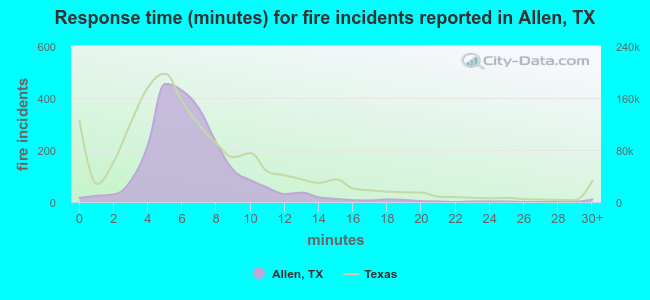 The median response time based on all reported fire incidents is 6 minutes. This is close to the state median value.
The median response time in Allen, TX compared to nearest cities:
(Note: Based on data for all years, including only cities with at least 500 fire incidents)
| Allen: | 6 minutes |
| Lucas: | 9 minutes |
| Plano: | 5 minutes |
| McKinney: | 6 minutes |
| Frisco: | 5 minutes |
| Wylie: | 6 minutes |
| Sachse: | 6 minutes |
| Richardson: | 5 minutes |
| Princeton: | 11 minutes |
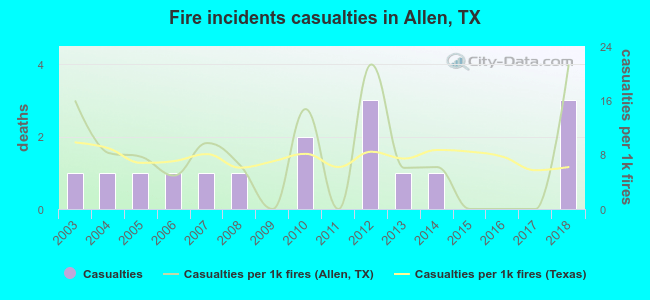 According to the data from the years 2003 - 2018 the average number of fire-related casualties per year is 1. The highest number of reported casualties - 3 took place in 2012, and the lowest - 0 in 2009. The data has a growing trend.
The average number of injuries per 1,000 fires is 8. This indicator was the highest - 21 in 2012, and the lowest 0 in 2009. The trend for casualties per 1,000 fires is increasing. Compared to the Texas value the number of casualties per 1,000 fires is about the same.
According to the data from the years 2003 - 2018 the average number of fire-related casualties per year is 1. The highest number of reported casualties - 3 took place in 2012, and the lowest - 0 in 2009. The data has a growing trend.
The average number of injuries per 1,000 fires is 8. This indicator was the highest - 21 in 2012, and the lowest 0 in 2009. The trend for casualties per 1,000 fires is increasing. Compared to the Texas value the number of casualties per 1,000 fires is about the same.
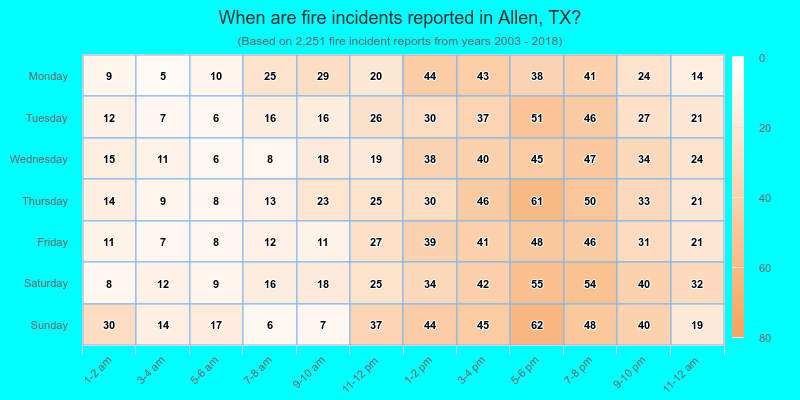
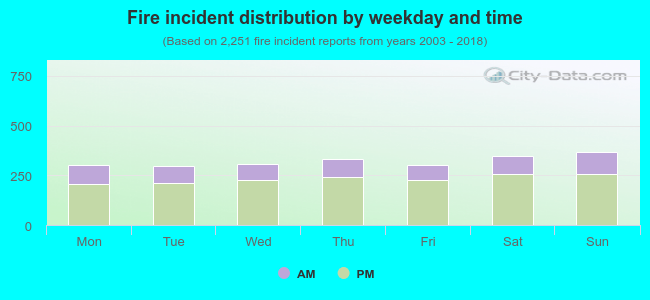 27.8% incidents where reported in the morning and 72.2% in the evening. The most fires (16.4%) took place on Sunday, and the least (13.1%) on Tuesday.
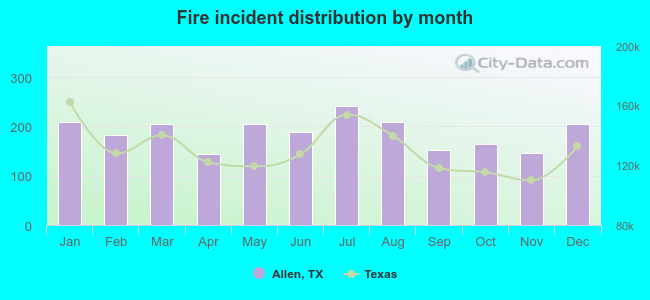 Based on the 2,251 fires from years 2003 - 2018 most fires (10.8%) took place during July, and the least (6.4%) in April.
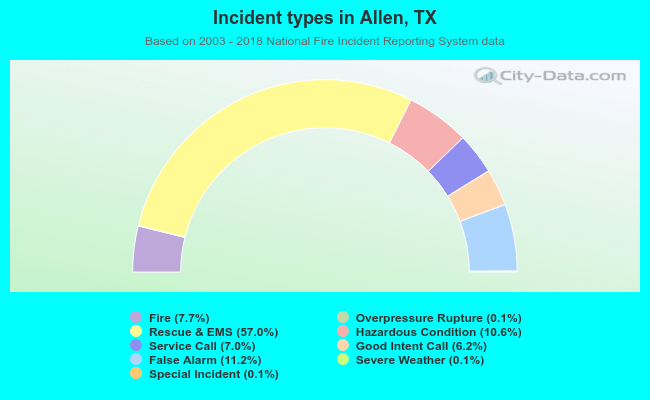 Out of all 29,207 cases reported during the years 2003 - 2018, the most belonged to the categories: Rescue & EMS (57.0%), False Alarm (11.2%), and Hazardous Condition (10.6%).
 When looking into fire subcategories, the most incidents belonged to: Outside Fires (39.4%), and Structure Fires (38.4%).