Fairview: Fire Incidents, Texas (TX)
Where are fire incidents reported in Fairview, TX
Something went wrong! Please refresh the page.
|
| |||||||||||||||||||||||||||||||||||||||||||||||||||||||||||||||||||||||||||||||||||||||||||||||||||||||||||||
2003 - 2018 National Fire Incident Reporting System (NFIRS) incidents
- Incident types reported to NFIRS in Fairview, TX
- 2,16849.9%Rescue & EMS
- 66915.4%Service Call
- 4139.5%Fire
- 4029.2%Good Intent Call
- 3768.7%False Alarm
- 3037.0%Hazardous Condition
- 70.2%Severe Weather
- 50.1%Overpressure Rupture
- Fire incident types reported to NFIRS in Fairview, TX
- 19346.7%Outside Fires
- 14936.1%Structure Fires
- 5513.3%Mobile Property/Vehicle Fires
- 163.9%Other
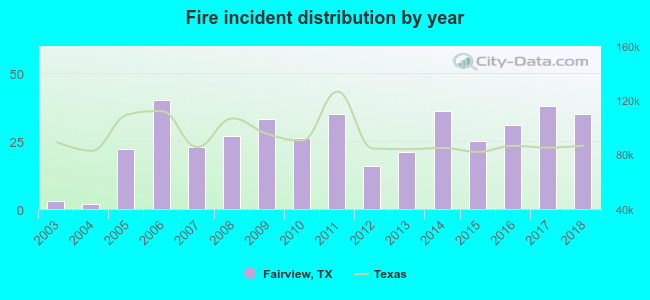 Based on the data from the years 2003 - 2018 the average number of fire incidents per year is 26. The highest number of reported fires - 40 took place in 2006, and the least - 2 in 2004. The data has a rising trend.
The average number of yearly fire incidents per 10k residents in Fairview, TX compared to nearest cities:
(Note: Based on data for the last 3 years, including only cities with population 5,000 and above)
| Fairview: | 41.5 |
| McKinney: | 16.5 |
| Lucas: | 54.9 |
| Allen: | 14.0 |
| Princeton: | 102.0 |
| Murphy: | 16.6 |
| Melissa: | 104.9 |
| Plano: | 14.4 |
| Wylie: | 21.6 |
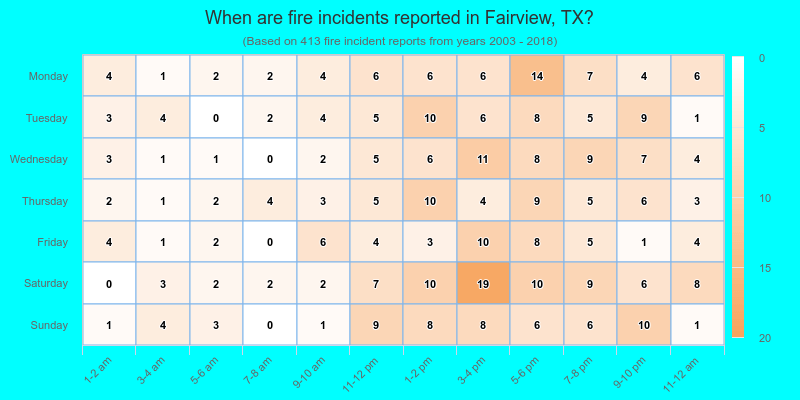
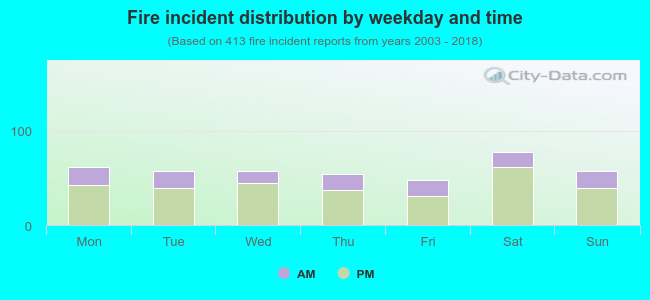 28.3% incidents where reported in the morning and 71.7% in the evening. The most fires (18.9%) took place on Saturday, and the least (11.6%) on Friday.
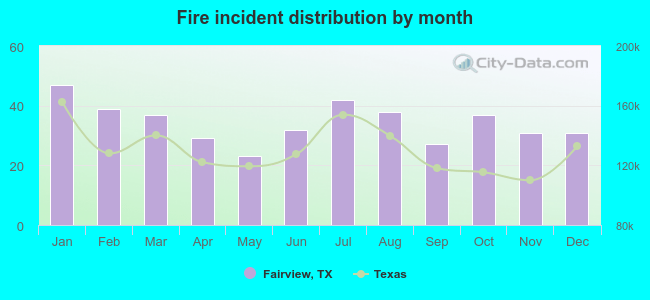 Based on the 413 incident reports from years 2003 - 2018 most fires (11.4%) took place during January, and the least (5.6%) in May.
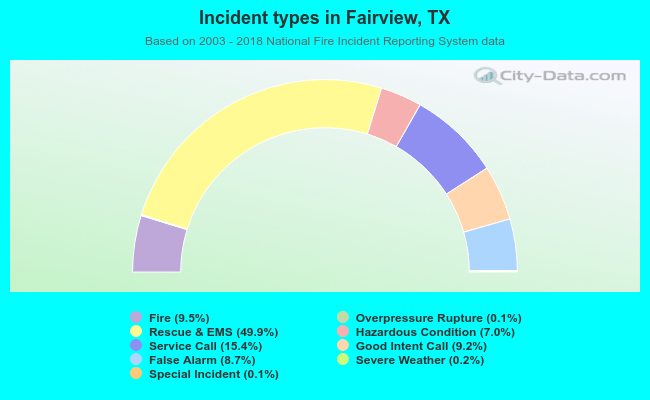 Out of all 4,346 cases reported during the years 2003 - 2018, the most belonged to the categories: Rescue & EMS (49.9%), Service Call (15.4%), and Fire (9.5%).
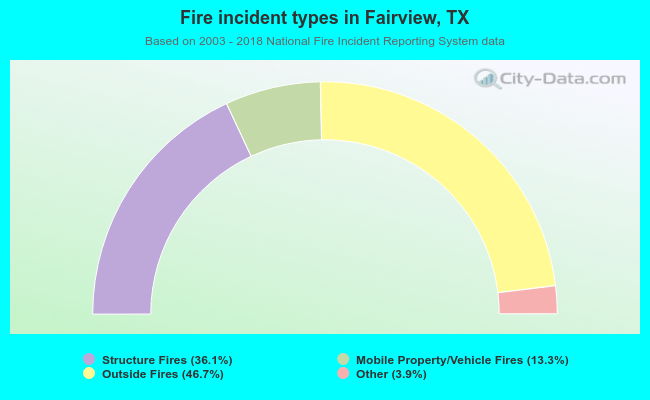 When looking into fire subcategories, the most reports belonged to: Outside Fires (46.7%), and Structure Fires (36.1%).