Alma: Fire Incidents, Michigan (MI)
Where are fire incidents reported in Alma, MI
Something went wrong! Please refresh the page.
|
| |||||||||||||||||||||||||||||||||||||||||||||||||||||||||||||||||||||||||||||||||||||||||||||||||||||||||||||
2002 - 2018 National Fire Incident Reporting System (NFIRS) incidents
- Incident types reported to NFIRS in Alma, MI
- 97145.4%Fire
- 31614.8%Rescue & EMS
- 23511.0%Hazardous Condition
- 2009.4%False Alarm
- 1587.4%Good Intent Call
- 1366.4%Service Call
- 1165.4%Special Incident
- 30.1%Severe Weather
- Fire incident types reported to NFIRS in Alma, MI
- 51152.6%Structure Fires
- 24024.7%Outside Fires
- 14214.6%Mobile Property/Vehicle Fires
- 788.0%Other
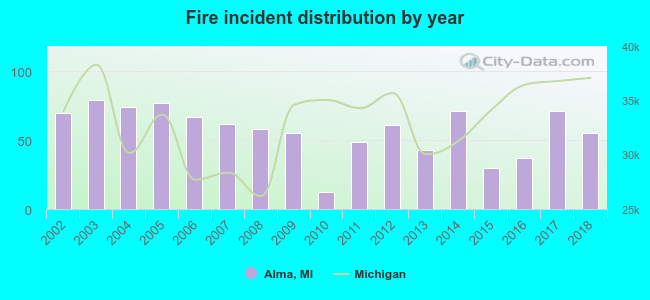 According to the data from the years 2002 - 2018 the average number of fires per year is 57. The highest number of reported fires - 79 took place in 2003, and the least - 12 in 2010. The data has a dropping trend.
The average number of yearly fire incidents per 10k residents in Alma, MI compared to nearest cities:
(Note: Based on data for the last 3 years, including only cities with population 5,000 and above)
| Alma: | 58.9 |
| Mount Pleasant: | 0.9 |
| Midland: | 37.2 |
| Freeland: | 32.5 |
| Greenville: | 71.6 |
| Ionia: | 74.9 |
| Belding: | 102.6 |
| Saginaw: | 121.3 |
| Owosso: | 55.9 |
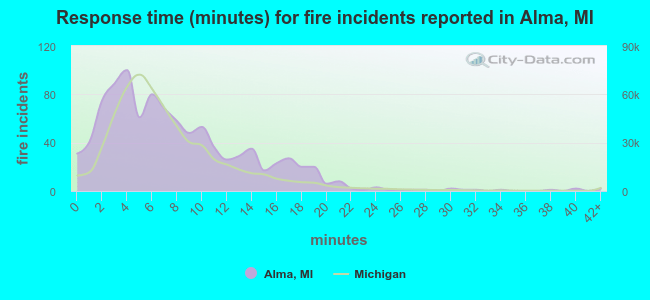 The median response time based on all reported fire incidents is 7 minutes. This is close to the state median value.
The median response time in Alma, MI compared to nearest cities:
(Note: Based on data for all years, including only cities with at least 500 fire incidents)
| Alma: | 7 minutes |
| Ithaca: | 8 minutes |
| Hemlock: | 12 minutes |
| Sheridan: | 9 minutes |
| Sanford: | 8 minutes |
| Midland: | 6 minutes |
| Chesaning: | 10 minutes |
| Clare: | 12 minutes |
| Greenville: | 7 minutes |
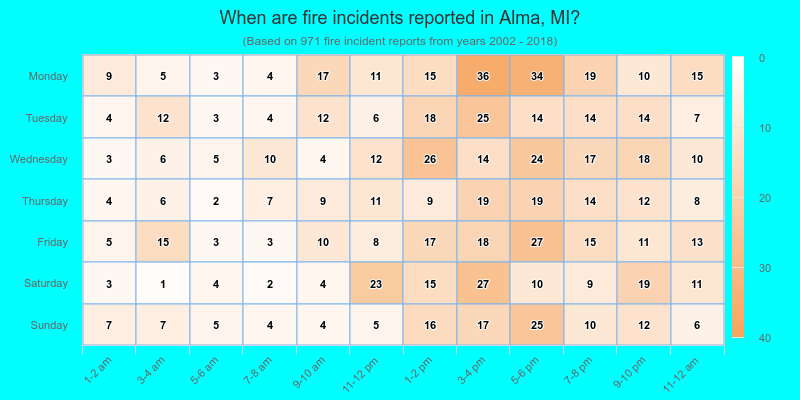
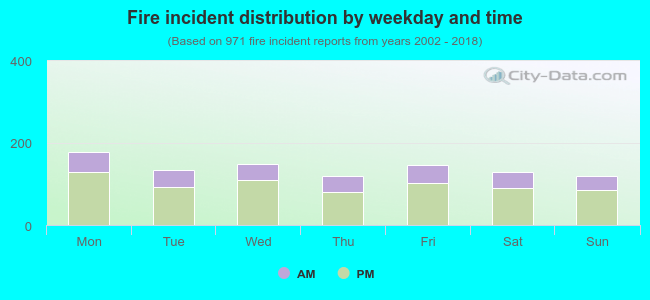 29.0% incidents where reported in the morning and 71.0% in the evening. The most fires (18.3%) took place on Monday, and the least (12.2%) on Sunday.
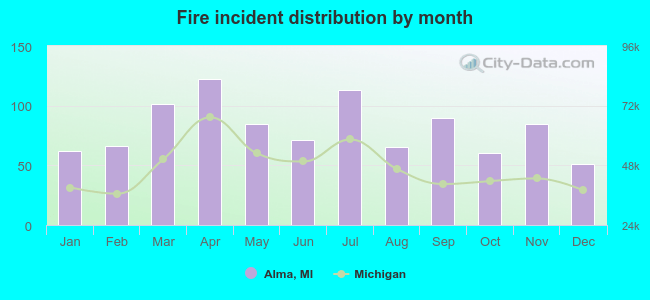 Based on the 971 fire incident reports from years 2002 - 2018 most fires (12.6%) took place during April, and the least (5.3%) in December.
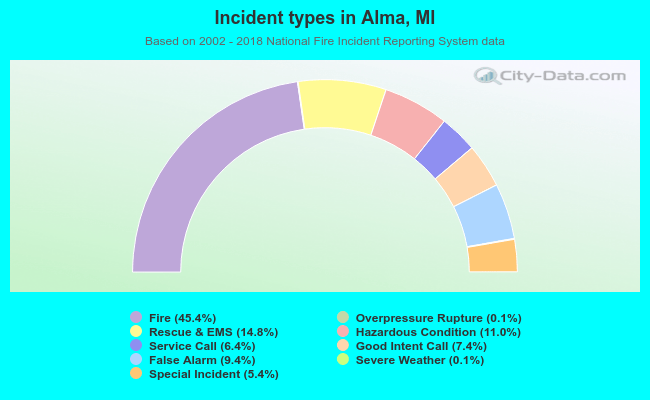 Out of all 2,137 cases reported during the years 2002 - 2018, the most belonged to the categories: Fire (45.4%), Rescue & EMS (14.8%), and Hazardous Condition (11.0%).
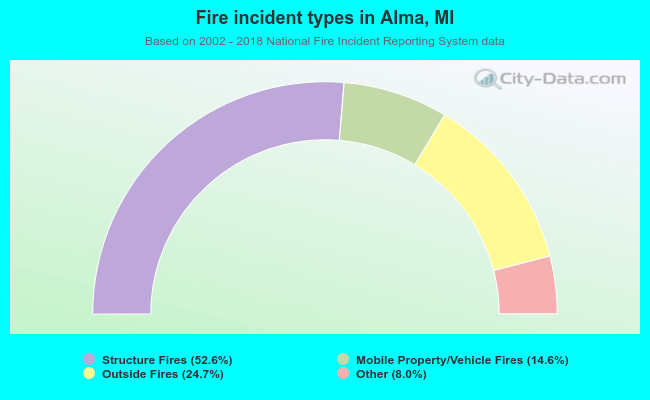 When looking into fire subcategories, the most reports belonged to: Structure Fires (52.6%), and Outside Fires (24.7%).