Midland: Fire Incidents, Michigan (MI)
Where are fire incidents reported in Midland, MI
Something went wrong! Please refresh the page.
| Fire incidents reported | |
|---|---|
| Sreet name | Count |
| SAGINAW RD | 254 |
| EASTMAN AVE | 104 |
| ASHMAN ST | 88 |
| JEFFERSON AVE | 78 |
| BAY CITY RD | 72 |
| MAIN ST | 66 |
| BAKER RD | 56 |
| ISABELLA RD | 56 |
| EASTLAWN DR | 54 |
| POSEYVILLE RD | 54 |
| GORDONVILLE RD | 52 |
| MERIDIAN RD | 44 |
| WACKERLY ST | 44 |
| ABBOTT RD | 38 |
| SHAFFER RD | 38 |
| PATTERSON RD | 36 |
| HALEY ST | 34 |
| ISABELLA ST | 34 |
| PINE RIVER RD | 34 |
| HEDGEWOOD DR | 32 |
| WALDO AVE | 32 |
| FLAJOLE RD | 30 |
| HOMER RD | 30 |
| PATRICK RD | 30 |
| STEWART RD | 30 |
| WASHINGTON ST | 30 |
| CHIPPEWA RIVER RD | 28 |
| EASTMAN | 28 |
| MILLER RD | 28 |
| SUGNET RD | 28 |
| Other | 940 |
2002 - 2018 National Fire Incident Reporting System (NFIRS) incidents
- Incident types reported to NFIRS in Midland, MI
- 20,72652.5%Rescue & EMS
- 7,28618.5%Hazardous Condition
- 3,1888.1%Service Call
- 3,0137.6%Good Intent Call
- 2,5556.5%False Alarm
- 2,5026.3%Fire
- 1250.3%Severe Weather
- 490.1%Special Incident
- Fire incident types reported to NFIRS in Midland, MI
- 1,16746.6%Structure Fires
- 74629.8%Outside Fires
- 45118.0%Mobile Property/Vehicle Fires
- 1385.5%Other
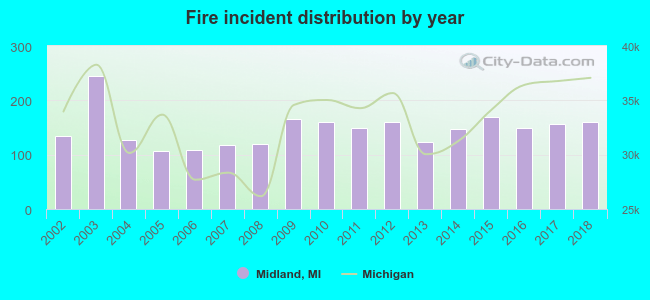 Based on the data from the years 2002 - 2018 the average number of fires per year is 147. The highest number of reported fire incidents - 245 took place in 2003, and the least - 107 in 2005. The data has an increasing trend.
The average number of yearly fire incidents per 10k residents in Midland, MI compared to nearest cities:
(Note: Based on data for the last 3 years, including only cities with population 5,000 and above)
| Midland: | 37.2 |
| Freeland: | 32.5 |
| Bay City: | 61.5 |
| Carrollton: | 8.9 |
| Saginaw: | 121.3 |
| Buena Vista: | 2.9 |
| Bridgeport: | 13.4 |
| Mount Pleasant: | 0.9 |
| Alma: | 58.9 |
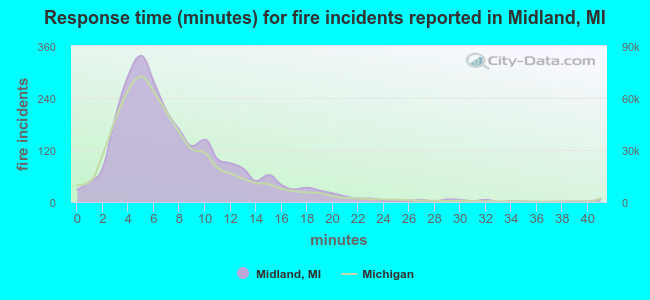 The median response time based on all reported fire incidents is 6 minutes. This is about the same as the Michigan median value.
The median response time in Midland, MI compared to nearest cities:
(Note: Based on data for all years, including only cities with at least 500 fire incidents)
| Midland: | 6 minutes |
| Sanford: | 8 minutes |
| Hemlock: | 12 minutes |
| Bay City: | 5 minutes |
| Essexville: | 6 minutes |
| Saginaw: | 5 minutes |
| Pinconning: | 11 minutes |
| Beaverton: | 12 minutes |
| Alma: | 7 minutes |
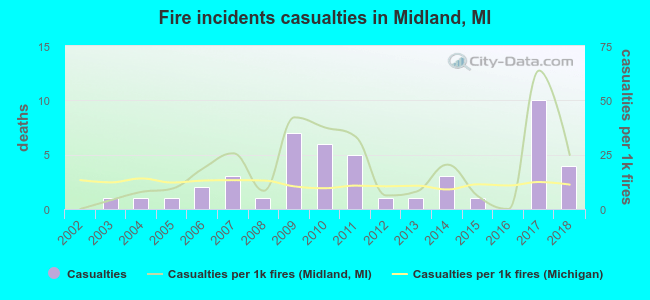 Based on the reports from the years 2002 - 2018 the average number of fire-related yearly casualties is 3. The highest number of reported injuries - 10 took place in 2017, and the lowest - 0 in 2002. The data has an increasing trend.
The average number of injuries per 1,000 fires is 19. This indicator was the highest - 64 in 2017, and the lowest 0 in 2002. The trend for injuries per 1,000 fires is growing. Compared to the Michigan value the number of casualties per 1,000 incidents is higher.
Based on the reports from the years 2002 - 2018 the average number of fire-related yearly casualties is 3. The highest number of reported injuries - 10 took place in 2017, and the lowest - 0 in 2002. The data has an increasing trend.
The average number of injuries per 1,000 fires is 19. This indicator was the highest - 64 in 2017, and the lowest 0 in 2002. The trend for injuries per 1,000 fires is growing. Compared to the Michigan value the number of casualties per 1,000 incidents is higher.Casualties per 1,000 incidents in Midland, MI compared to nearest cities:
(Note: Based on data for all years, including only cities with at least 500 fire incidents)
| Midland: | 18.8 |
| Sanford: | 6.3 |
| Hemlock: | 1.8 |
| Bay City: | 14.9 |
| Essexville: | 1.9 |
| Saginaw: | 17.7 |
| Pinconning: | 8.7 |
| Beaverton: | 3.8 |
| Alma: | 1.0 |
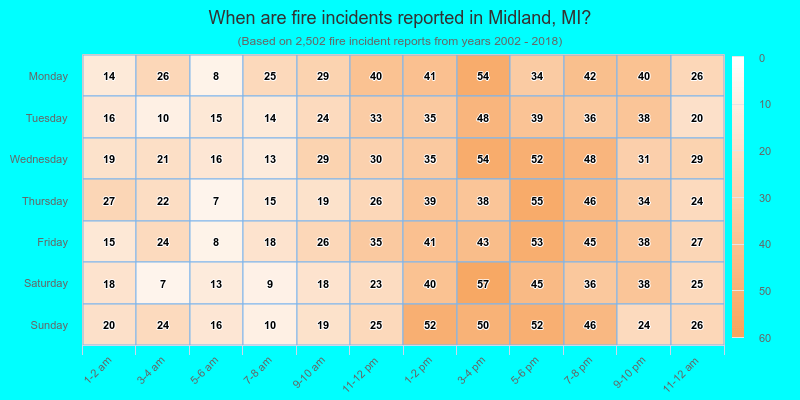
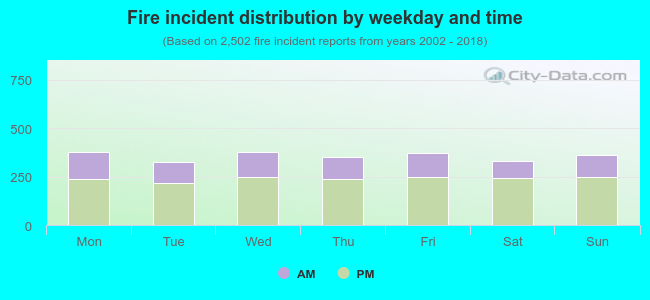 33.0% incidents where reported in the morning and 67.0% in the evening. The most fires (15.1%) took place on Monday, and the least (13.1%) on Tuesday.
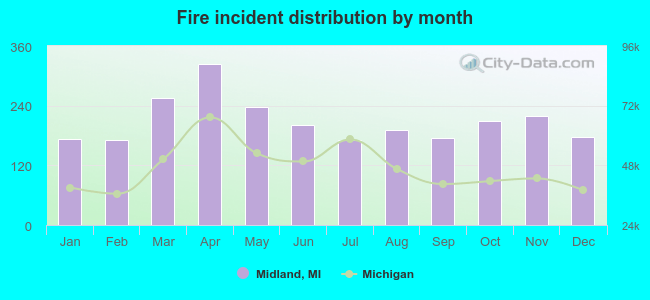 Based on the 2,502 incident reports from years 2002 - 2018 most fires (12.9%) took place during April, and the least (6.8%) in July.
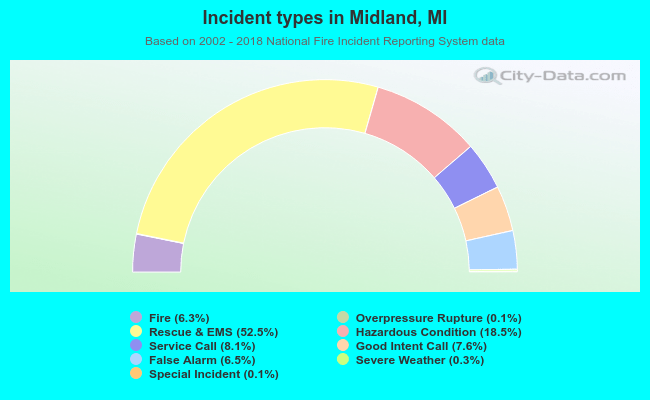 Out of all 39,478 cases reported during the years 2002 - 2018, the most belonged to the categories: Rescue & EMS (52.5%), Hazardous Condition (18.5%), and Service Call (8.1%).
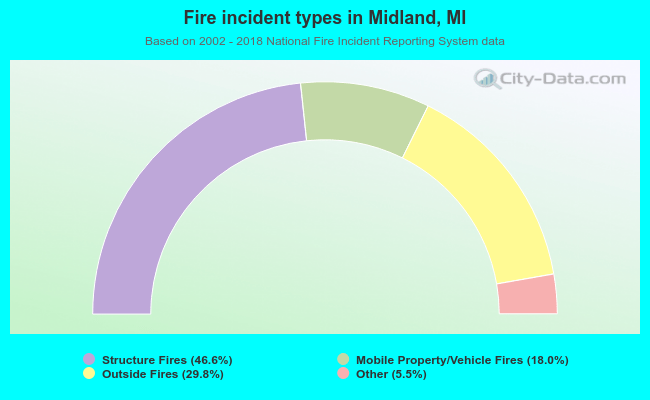 When looking into fire subcategories, the most incidents belonged to: Structure Fires (46.6%), and Outside Fires (29.8%).