Amesbury: Fire Incidents, Massachusetts (MA)
Where are fire incidents reported in Amesbury, MA
Something went wrong! Please refresh the page.
| Fire incidents reported | |
|---|---|
| Sreet name | Count |
| MAIN ST | 204 |
| MACY ST | 104 |
| HAVERHILL RD | 72 |
| ELM ST | 58 |
| WHITEHALL RD | 56 |
| CARRIAGE HILL RD | 48 |
| FRIEND ST | 48 |
| MARKET ST | 48 |
| HIGH ST | 46 |
| RTE 495 EXPY | 36 |
| KIMBALL RD | 32 |
| CONGRESS ST | 30 |
| ROCKYHILL RD | 28 |
| POWOW | 26 |
| FERN AVE | 22 |
| CLINTON ST | 20 |
| MIDDLE RD | 20 |
| POWOW ST | 20 |
| RTE 495 NB | 20 |
| CHESTNUT ST | 18 |
| HIGHLAND ST | 18 |
| MACY TER | 18 |
| MASON CT | 18 |
| PROSPECT ST | 18 |
| S HUNT RD | 18 |
| BIRCHMEADOW RD | 16 |
| MERRIMAC ST | 16 |
| PLEASANT VALLEY RD | 16 |
| RTE 495 SB | 16 |
| SCHOOL ST | 16 |
2002 - 2018 National Fire Incident Reporting System (NFIRS) incidents
- Incident types reported to NFIRS in Amesbury, MA
- 11,09848.5%Rescue & EMS
- 4,82521.1%Service Call
- 2,58811.3%Hazardous Condition
- 2,1179.3%False Alarm
- 1,1715.1%Good Intent Call
- 9674.2%Fire
- 440.2%Special Incident
- 300.1%Severe Weather
- 270.1%Overpressure Rupture
- Fire incident types reported to NFIRS in Amesbury, MA
- 54356.2%Structure Fires
- 25226.1%Outside Fires
- 11712.1%Mobile Property/Vehicle Fires
- 555.7%Other
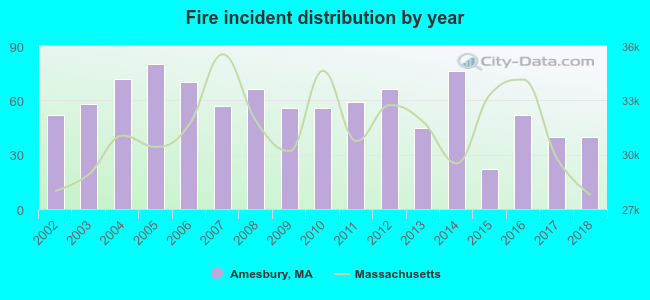 Based on the data from the years 2002 - 2018 the average number of fire incidents per year is 57. The highest number of reported fire incidents - 80 took place in 2005, and the least - 22 in 2015. The data has a declining trend.
The average number of yearly fire incidents per 10k residents in Amesbury, MA compared to nearest cities:
(Note: Based on data for the last 3 years, including only cities with population 5,000 and above)
| Amesbury: | 35.3 |
| Newburyport: | 8.4 |
| Merrimac: | 68.9 |
| Newbury: | 30.5 |
| Groveland: | 32.5 |
| Georgetown: | 55.4 |
| Haverhill: | 33.9 |
| North Andover: | 38.9 |
| Methuen: | 26.7 |
 The median response time based on all reported fire incidents is 5 minutes. This is higher than the state median value.
The median response time in Amesbury, MA compared to nearest cities:
(Note: Based on data for all years, including only cities with at least 500 fire incidents)
| Amesbury: | 5 minutes |
| Merrimac: | 5 minutes |
| Salisbury: | 4 minutes |
| Georgetown: | 5 minutes |
| Haverhill: | 4 minutes |
| Rowley: | 7 minutes |
| Boxford: | 8 minutes |
| Ipswich: | 5 minutes |
| Topsfield: | 4 minutes |
 According to the reports from the years 2002 - 2018 the average number of fire-related yearly casualties is 1. The highest number of reported casualties - 2 took place in 2002, and the lowest - 0 in 2008. The data has a dropping trend.
The average number of injuries per 1,000 fires is 17. This indicator was the highest - 91 in 2015, and the lowest 0 in 2008. The trend for injuries per 1,000 fire incidents is dropping. Compared to the Massachusetts value the number of casualties per 1,000 fire incidents is higher.
According to the reports from the years 2002 - 2018 the average number of fire-related yearly casualties is 1. The highest number of reported casualties - 2 took place in 2002, and the lowest - 0 in 2008. The data has a dropping trend.
The average number of injuries per 1,000 fires is 17. This indicator was the highest - 91 in 2015, and the lowest 0 in 2008. The trend for injuries per 1,000 fire incidents is dropping. Compared to the Massachusetts value the number of casualties per 1,000 fire incidents is higher.
 28.3% incidents where reported in the morning and 71.7% in the evening. The most fires (16.3%) took place on Monday, and the least (12.5%) on Wednesday.
 Based on the 967 fire incidents from years 2002 - 2018 most fires (11.6%) took place during April, and the least (6.2%) in October.
 Out of all 22,867 cases reported during the years 2002 - 2018, the most belonged to the categories: Rescue & EMS (48.5%), Service Call (21.1%), and Hazardous Condition (11.3%).
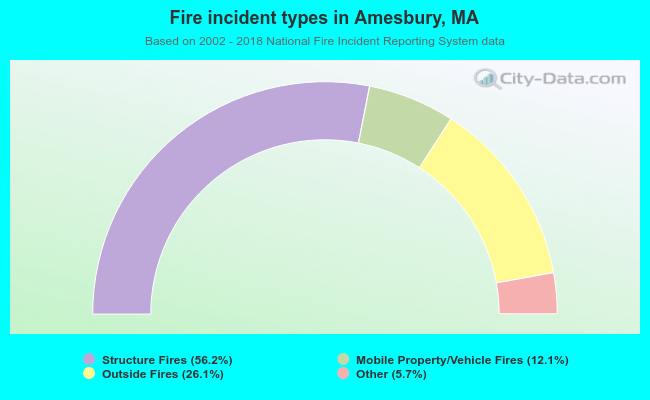 When looking into fire subcategories, the most incidents belonged to: Structure Fires (56.2%), and Outside Fires (26.1%).