Merrimac: Fire Incidents, Massachusetts (MA)
Where are fire incidents reported in Merrimac, MA
Something went wrong! Please refresh the page.
| Fire incidents reported | |
|---|---|
| Sreet name | Count |
| MAIN ST | 198 |
| GREENLEAF DR | 150 |
| CHURCH ST | 68 |
| BEARHILL RD | 50 |
| LOCUST ST | 50 |
| BROAD ST | 48 |
| SCHOOL ST | 46 |
| 495 N.B. NORTH OF BROAD | 40 |
| HADLEY RD | 40 |
| SHORE RD | 38 |
| RIVER RD | 36 |
| WINTER ST | 34 |
| EMERY ST | 30 |
| BIRCH MEADOW RD | 28 |
| 495 N.B. SOUTH OF BROAD | 26 |
| 495 NB NORTH OF BROAD | 26 |
| PROSPECT HILL | 26 |
| 495 S.B. SOUTH OF BROAD | 22 |
| 495 S.B. NORTH OF BROAD | 20 |
| SPRING HILL RD | 20 |
| 495 SB SOUTH OF BROAD | 18 |
| HIGHLAND RD | 16 |
| ALNETTE RD | 14 |
| GROVE ST | 14 |
| HEATH RD | 14 |
| ORCHARD ST | 14 |
| PINE ST | 14 |
| WOODLAND ST | 14 |
| CHAMPION ST | 12 |
| HANSOM DR | 12 |
2002 - 2018 National Fire Incident Reporting System (NFIRS) incidents
- Incident types reported to NFIRS in Merrimac, MA
- 3,47457.0%Rescue & EMS
- 82513.5%Fire
- 5719.4%Hazardous Condition
- 4427.3%False Alarm
- 4367.2%Good Intent Call
- 2914.8%Service Call
- 430.7%Severe Weather
- 80.1%Special Incident
- Fire incident types reported to NFIRS in Merrimac, MA
- 38746.9%Structure Fires
- 28935.0%Outside Fires
- 10412.6%Mobile Property/Vehicle Fires
- 455.5%Other
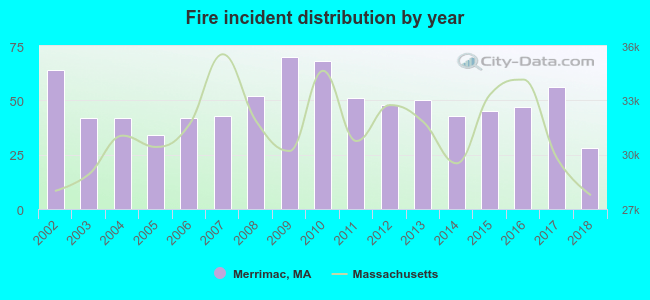 Based on the data from the years 2002 - 2018 the average number of fires per year is 49. The highest number of fires - 70 took place in 2009, and the least - 28 in 2018. The data has a decreasing trend.
The average number of yearly fire incidents per 10k residents in Merrimac, MA compared to nearest cities:
(Note: Based on data for the last 3 years, including only cities with population 5,000 and above)
| Merrimac: | 68.9 |
| Amesbury: | 35.3 |
| Haverhill: | 33.9 |
| Groveland: | 32.5 |
| Newburyport: | 8.4 |
| Georgetown: | 55.4 |
| Newbury: | 30.5 |
| Methuen: | 26.7 |
| North Andover: | 38.9 |
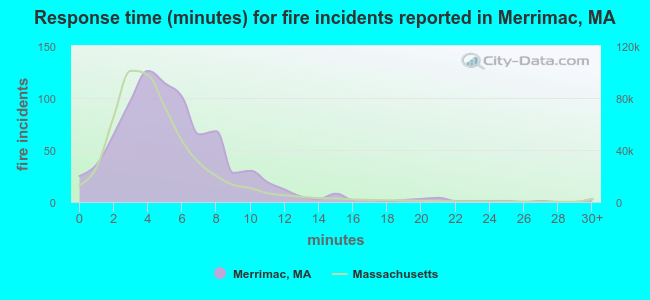 The median response time based on all reported fire incidents is 5 minutes. This is higher than the state median value.
The median response time in Merrimac, MA compared to nearest cities:
(Note: Based on data for all years, including only cities with at least 500 fire incidents)
| Merrimac: | 5 minutes |
| Amesbury: | 5 minutes |
| Haverhill: | 4 minutes |
| Georgetown: | 5 minutes |
| Salisbury: | 4 minutes |
| Rowley: | 7 minutes |
| Boxford: | 8 minutes |
| Methuen: | 4 minutes |
| North Andover: | 4 minutes |
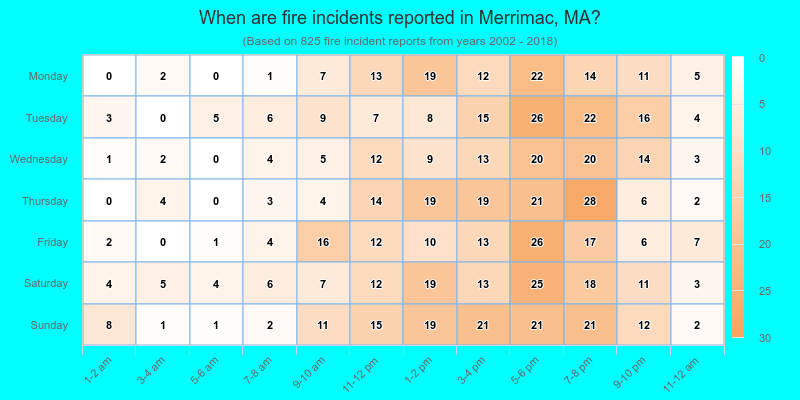
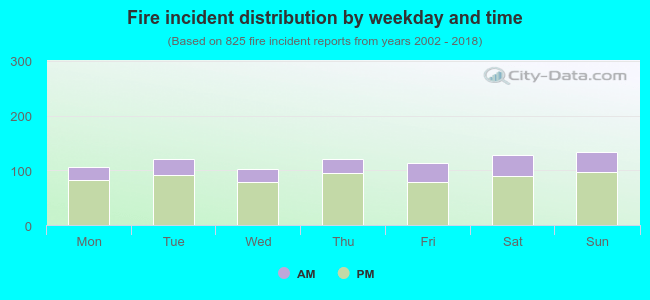 25.8% incidents where reported in the morning and 74.2% in the evening. The most fires (16.2%) took place on Sunday, and the least (12.5%) on Wednesday.
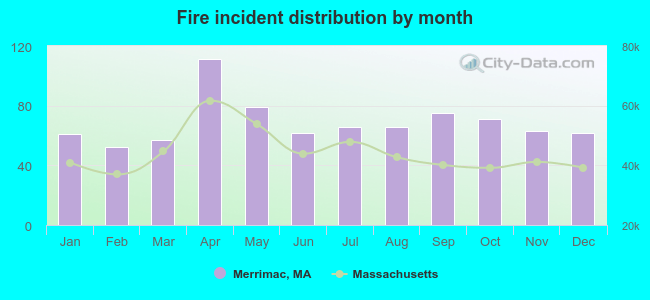 According to the 825 fire incident reports from years 2002 - 2018 most fires (13.5%) took place during April, and the least (6.3%) in February.
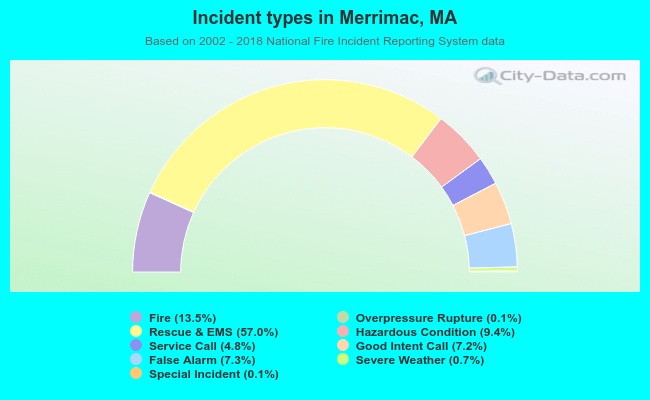 Out of all 6,096 cases reported during the years 2002 - 2018, the most belonged to the categories: Rescue & EMS (57.0%), Fire (13.5%), and Hazardous Condition (9.4%).
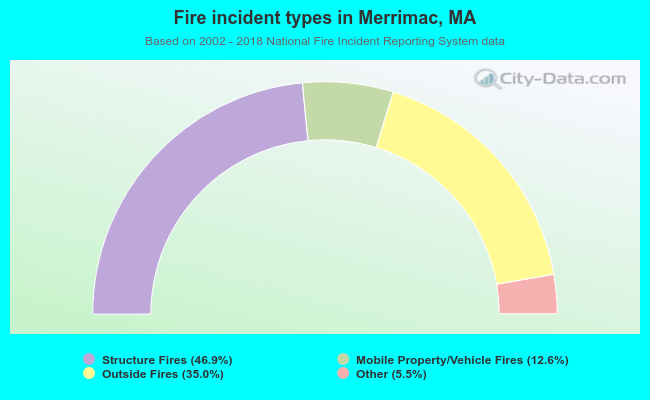 When looking into fire subcategories, the most reports belonged to: Structure Fires (46.9%), and Outside Fires (35.0%).