Amory: Fire Incidents, Mississippi (MS)
Where are fire incidents reported in Amory, MS
Something went wrong! Please refresh the page.
|
| |||||||||||||||||||||||||||||||||||||||||||||||||||||||||||||||||||||||||||||||||||||||||||||||||||||||||||||
| Other | 438 | |||||||||||||||||||||||||||||||||||||||||||||||||||||||||||||||||||||||||||||||||||||||||||||||||||||||||||||
2002 - 2018 National Fire Incident Reporting System (NFIRS) incidents
- Incident types reported to NFIRS in Amory, MS
- 3,36554.3%Rescue & EMS
- 1,62826.3%Fire
- 3786.1%Hazardous Condition
- 3255.2%Service Call
- 2574.1%Good Intent Call
- 2343.8%False Alarm
- Fire incident types reported to NFIRS in Amory, MS
- 79048.5%Outside Fires
- 60136.9%Structure Fires
- 18811.5%Mobile Property/Vehicle Fires
- 493.0%Other
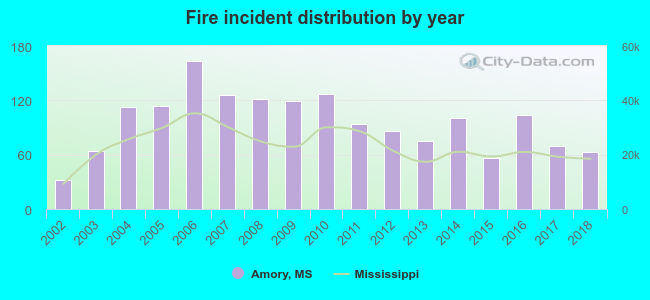 Based on the data from the years 2002 - 2018 the average number of fires per year is 96. The highest number of fire incidents - 163 took place in 2006, and the least - 32 in 2002. The data has a growing trend.
The average number of yearly fire incidents per 10k residents in Amory, MS compared to nearest cities:
(Note: Based on data for the last 3 years, including only cities with population 5,000 and above)
| Amory: | 111.2 |
| Aberdeen: | 182.3 |
| Tupelo: | 81.8 |
| West Point: | 91.0 |
| Saltillo: | 171.9 |
| Columbus: | 55.2 |
| Pontotoc: | 260.7 |
| Starkville: | 64.8 |
| New Albany: | 165.4 |
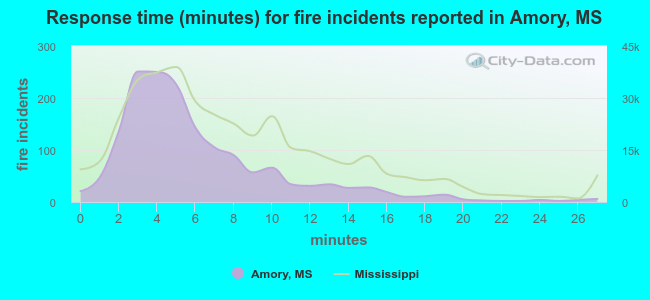 The median response time based on all reported fire incidents is 5 minutes. This is lower compared to the state median value.
The median response time in Amory, MS compared to nearest cities:
(Note: Based on data for all years, including only cities with at least 500 fire incidents)
| Amory: | 5 minutes |
| Nettleton: | 9 minutes |
| Aberdeen: | 3 minutes |
| Okolona: | 7 minutes |
| Shannon: | 8 minutes |
| Verona: | 5 minutes |
| Fulton: | 6 minutes |
| Tupelo: | 5 minutes |
| Mantachie: | 7 minutes |
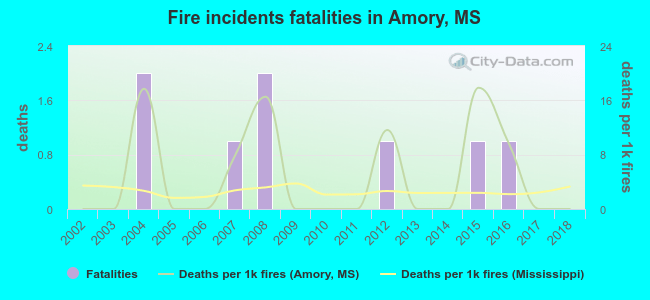 Based on the data from the years 2002 - 2018 the average number of fire-related yearly deaths is 0. The highest number of deaths - 2 took place in 2004, and the lowest - 0 in 2002. The data has a constant trend.
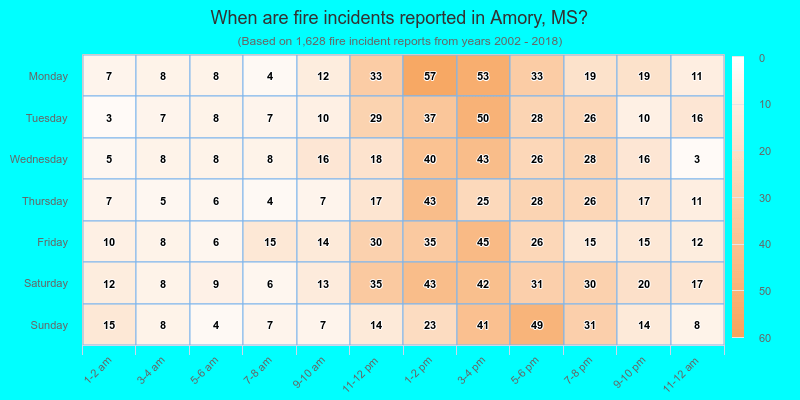
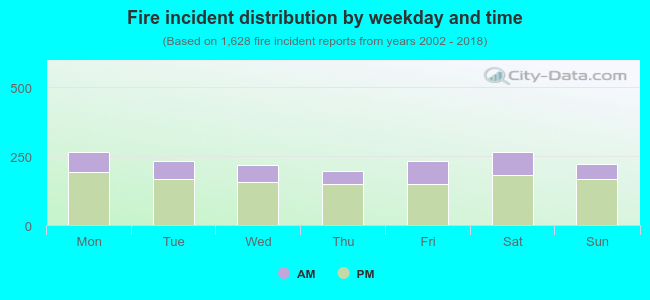 28.6% incidents where reported in the morning and 71.4% in the evening. The most fires (16.3%) took place on Saturday, and the least (12.0%) on Thursday.
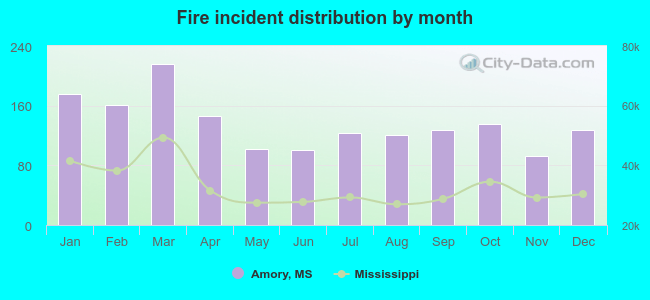 Based on the 1,628 fires from years 2002 - 2018 most fires (13.3%) took place during March, and the least (5.7%) in November.
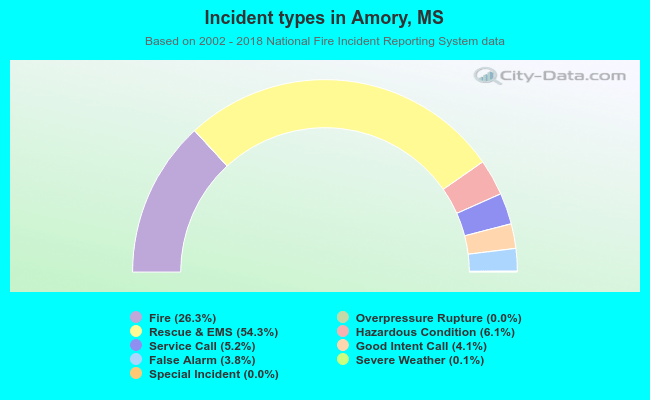 Out of all 6,197 cases reported during the years 2002 - 2018, the most belonged to the categories: Rescue & EMS (54.3%), Fire (26.3%), and Hazardous Condition (6.1%).
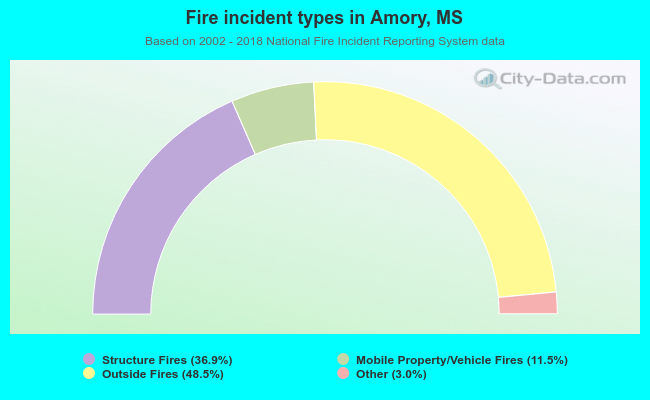 When looking into fire subcategories, the most incidents belonged to: Outside Fires (48.5%), and Structure Fires (36.9%).