Pontotoc: Fire Incidents, Mississippi (MS)
Where are fire incidents reported in Pontotoc, MS
Something went wrong! Please refresh the page.
|
| |||||||||||||||||||||||||||||||||||||||||||||||||||||||||||||||||||||||||||||||||||||||||||||||||||||||||||||
| Other | 624 | |||||||||||||||||||||||||||||||||||||||||||||||||||||||||||||||||||||||||||||||||||||||||||||||||||||||||||||
2003 - 2018 National Fire Incident Reporting System (NFIRS) incidents
- Incident types reported to NFIRS in Pontotoc, MS
- 2,45856.1%Fire
- 1,20527.5%Rescue & EMS
- 2726.2%Good Intent Call
- 1864.2%Hazardous Condition
- 1443.3%False Alarm
- 1052.4%Service Call
- 70.2%Special Incident
- Fire incident types reported to NFIRS in Pontotoc, MS
- 1,21449.4%Outside Fires
- 92537.6%Structure Fires
- 27311.1%Mobile Property/Vehicle Fires
- 461.9%Other
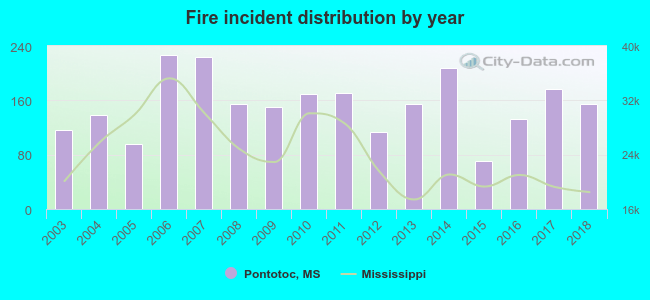 Based on the data from the years 2003 - 2018 the average number of fire incidents per year is 154. The highest number of reported fire incidents - 227 took place in 2006, and the least - 71 in 2015. The data has an increasing trend.
The average number of yearly fire incidents per 10k residents in Pontotoc, MS compared to nearest cities:
(Note: Based on data for the last 3 years, including only cities with population 5,000 and above)
| Pontotoc: | 260.7 |
| Tupelo: | 81.8 |
| New Albany: | 165.4 |
| Saltillo: | 171.9 |
| Oxford: | 98.1 |
| Ripley: | 177.6 |
| Amory: | 111.2 |
| Booneville: | 373.3 |
| Aberdeen: | 182.3 |
 The median response time based on all reported fire incidents is 9 minutes. This is higher than the state median value.
The median response time in Pontotoc, MS compared to nearest cities:
(Note: Based on data for all years, including only cities with at least 500 fire incidents)
| Pontotoc: | 9 minutes |
| Blue Springs: | 9 minutes |
| Tupelo: | 5 minutes |
| New Albany: | 7 minutes |
| Verona: | 5 minutes |
| Shannon: | 8 minutes |
| Saltillo: | 8 minutes |
| Okolona: | 7 minutes |
| Myrtle: | 8 minutes |
 According to the data from the years 2003 - 2018 the average number of fire-related fatalities per year is 0. The highest number of deaths - 1 took place in 2008, and the lowest - 0 in 2003. The data has a constant trend.
 27.3% incidents where reported in the morning and 72.7% in the evening. The most fires (16.7%) took place on Saturday, and the least (11.4%) on Tuesday.
 Based on the 2,458 reports from years 2003 - 2018 most fires (14.9%) took place during March, and the least (4.9%) in June.
 Out of all 4,385 cases reported during the years 2003 - 2018, the most belonged to the categories: Fire (56.1%), Rescue & EMS (27.5%), and Good Intent Call (6.2%).
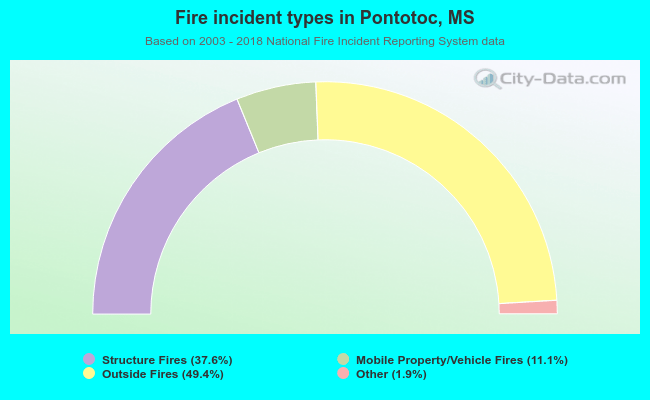 When looking into fire subcategories, the most incidents belonged to: Outside Fires (49.4%), and Structure Fires (37.6%).