Anniston: Fire Incidents, Alabama (AL)
Where are fire incidents reported in Anniston, AL
Something went wrong! Please refresh the page.
| Fire incidents reported | |
|---|---|
| Sreet name | Count |
| MCCLELLAN BLVD | 205 |
| NOBLE ST | 175 |
| BYNUM LEATHERWOOD RD | 120 |
| QUINTARD AVE | 105 |
| US HWY 431 | 80 |
| AL HWY 9 | 75 |
| CHOCCOLOCCO RD | 75 |
| CHRISTINE AVE | 75 |
| GLADE RD | 65 |
| GLENADDIE AVE | 65 |
| GREENBRIER DEAR RD | 65 |
| OLD GADSDEN HWY | 65 |
| CORNING ST | 60 |
| MORRISVILLE RD | 60 |
| VETERANS MEMORIAL PKY | 60 |
| 29TH ST | 55 |
| SAKS RD | 55 |
| WILMER AVE | 55 |
| 18TH ST | 50 |
| ALEXANDRIA RD | 50 |
| AMMONS ST | 50 |
| COLEMAN RD | 50 |
| FRONT ST | 50 |
| MOORE AVE | 50 |
| PARKWOOD DR | 50 |
| COTTAQUILLA RD | 49 |
| 10TH ST | 45 |
| 14TH ST | 45 |
| 34TH ST | 45 |
| GURNEE AVE | 45 |
2004 - 2018 National Fire Incident Reporting System (NFIRS) incidents
- Incident types reported to NFIRS in Anniston, AL
- 13,68859.1%Rescue & EMS
- 3,13513.5%Good Intent Call
- 2,98212.9%Service Call
- 1,4596.3%Fire
- 1,2085.2%False Alarm
- 6252.7%Hazardous Condition
- 310.1%Special Incident
- Fire incident types reported to NFIRS in Anniston, AL
- 63243.3%Outside Fires
- 59440.7%Structure Fires
- 18512.7%Mobile Property/Vehicle Fires
- 483.3%Other
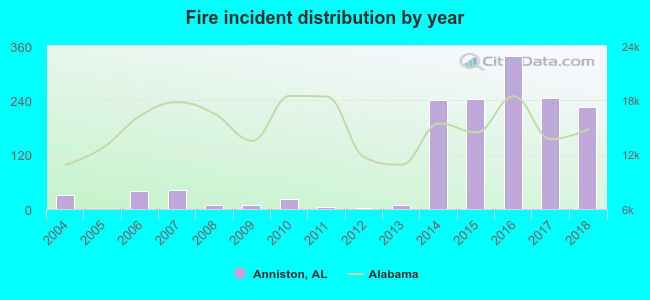 Based on the data from the years 2004 - 2018 the average number of fire incidents per year is 97. The highest number of reported fires - 338 took place in 2016, and the least - 0 in 2005. The data has an increasing trend.
The average number of yearly fire incidents per 10k residents in Anniston, AL compared to nearest cities:
(Note: Based on data for the last 3 years, including only cities with population 5,000 and above)
| Anniston: | 119.9 |
| Oxford: | 83.4 |
| Jacksonville: | 66.4 |
| Lincoln: | 170.9 |
| Southside: | 32.7 |
| Glencoe: | 85.7 |
| Talladega: | 68.3 |
| Rainbow City: | 50.3 |
| Gadsden: | 58.5 |
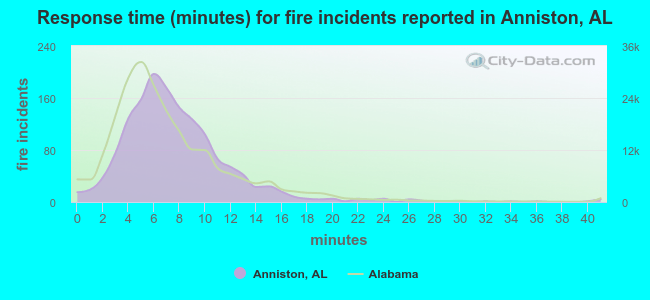 The median response time based on all reported fire incidents is 7 minutes. This is close to the state median value.
The median response time in Anniston, AL compared to nearest cities:
(Note: Based on data for all years, including only cities with at least 500 fire incidents)
| Anniston: | 7 minutes |
| Oxford: | 6 minutes |
| Jacksonville: | 6 minutes |
| Heflin: | 10 minutes |
| Piedmont: | 8 minutes |
| Talladega: | 8 minutes |
| Gadsden: | 5 minutes |
| Centre: | 11 minutes |
| Altoona: | 12 minutes |
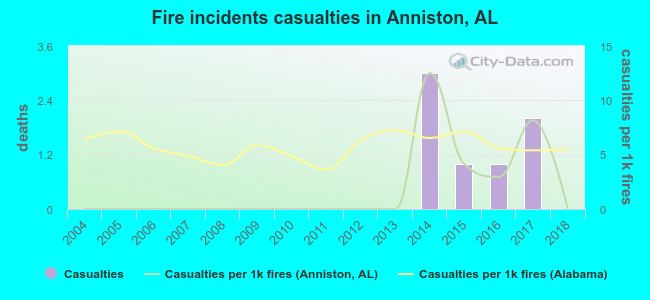 Based on the reports from the years 2004 - 2018 the average number of fire-related casualties per year is 0. The highest number of reported casualties - 3 took place in 2014, and the lowest - 0 in 2004. The data has a constant trend.
The average number of casualties per 1,000 fires is 2. This indicator was the highest - 13 in 2014, and the lowest 0 in 2004. The trend for injuries per 1,000 fire incidents is constant. Compared to the state value the number of casualties per 1,000 fire incidents is about the same.
Based on the reports from the years 2004 - 2018 the average number of fire-related casualties per year is 0. The highest number of reported casualties - 3 took place in 2014, and the lowest - 0 in 2004. The data has a constant trend.
The average number of casualties per 1,000 fires is 2. This indicator was the highest - 13 in 2014, and the lowest 0 in 2004. The trend for injuries per 1,000 fire incidents is constant. Compared to the state value the number of casualties per 1,000 fire incidents is about the same.
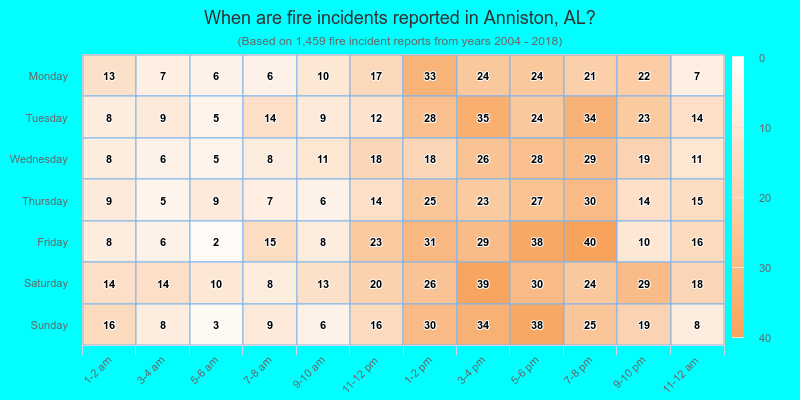
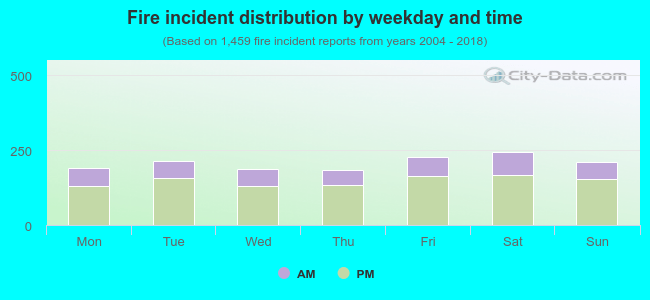 28.9% incidents where reported in the morning and 71.1% in the evening. The most fires (16.8%) took place on Saturday, and the least (12.6%) on Thursday.
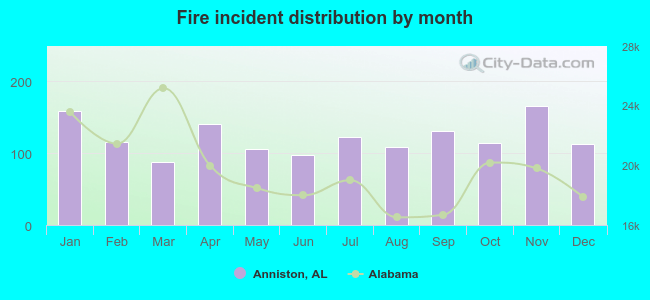 Based on the 1,459 fire incident reports from years 2004 - 2018 most fires (11.4%) took place during November, and the least (6.0%) in March.
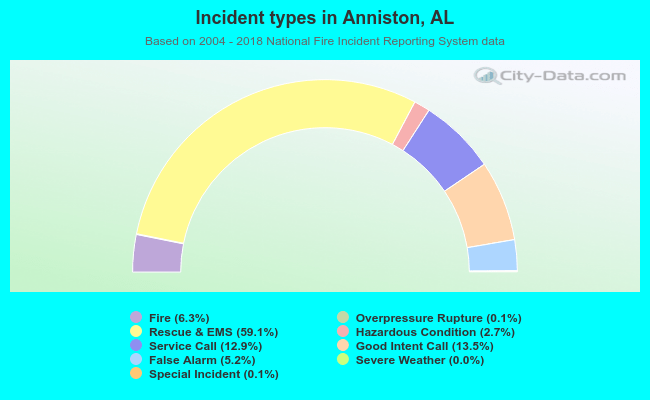 Out of all 23,152 cases reported during the years 2004 - 2018, the most belonged to the categories: Rescue & EMS (59.1%), Good Intent Call (13.5%), and Service Call (12.9%).
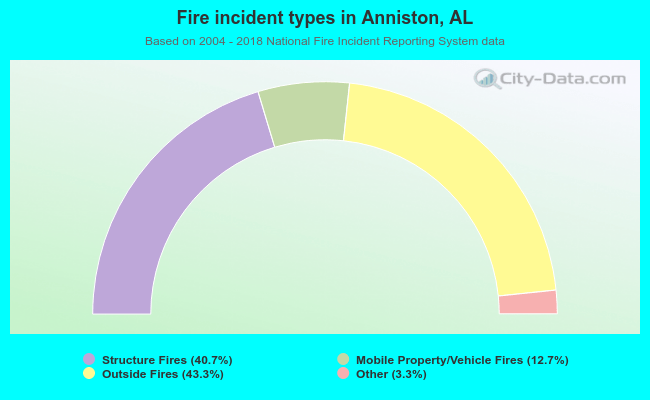 When looking into fire subcategories, the most reports belonged to: Outside Fires (43.3%), and Structure Fires (40.7%).