Rainbow City: Fire Incidents, Alabama (AL)
Where are fire incidents reported in Rainbow City, AL
Something went wrong! Please refresh the page.
|
| |||||||||||||||||||||||||||||||||||||||||||||||||||||||||||||||||||||||||||||||||||||||||||||||||||||||||||||
2004 - 2018 National Fire Incident Reporting System (NFIRS) incidents
- Incident types reported to NFIRS in Rainbow City, AL
- 2,75161.4%Rescue & EMS
- 1,04623.3%Service Call
- 3307.4%Good Intent Call
- 1894.2%Fire
- 1052.3%False Alarm
- 471.0%Hazardous Condition
- 130.3%Severe Weather
- Fire incident types reported to NFIRS in Rainbow City, AL
- 10153.4%Outside Fires
- 6232.8%Structure Fires
- 2010.6%Mobile Property/Vehicle Fires
- 63.2%Other
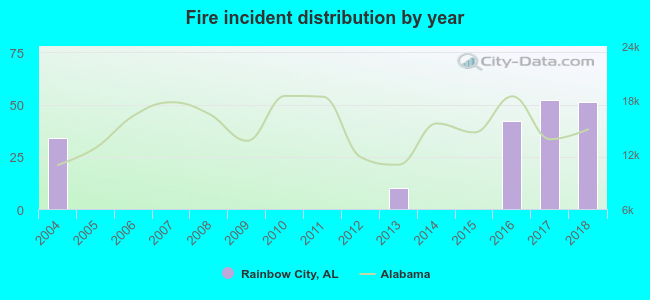 According to the data from the years 2004 - 2018 the average number of fire incidents per year is 13. The highest number of reported fires - 52 took place in 2017, and the least - 0 in 2005. The data has a growing trend.
The average number of yearly fire incidents per 10k residents in Rainbow City, AL compared to nearest cities:
(Note: Based on data for the last 3 years, including only cities with population 5,000 and above)
| Rainbow City: | 50.3 |
| Southside: | 32.7 |
| Attalla: | 42.6 |
| Gadsden: | 58.5 |
| Glencoe: | 85.7 |
| Boaz: | 86.4 |
| Jacksonville: | 66.4 |
| Anniston: | 119.9 |
| Albertville: | 115.0 |

 30.2% incidents where reported in the morning and 69.8% in the evening. The most fires (18.0%) took place on Saturday, and the least (11.6%) on Tuesday.
 According to the 189 reports from years 2004 - 2018 most fires (17.5%) took place during March, and the least (3.2%) in July.
 Out of all 4,484 cases reported during the years 2004 - 2018, the most belonged to the categories: Rescue & EMS (61.4%), Service Call (23.3%), and Good Intent Call (7.4%).
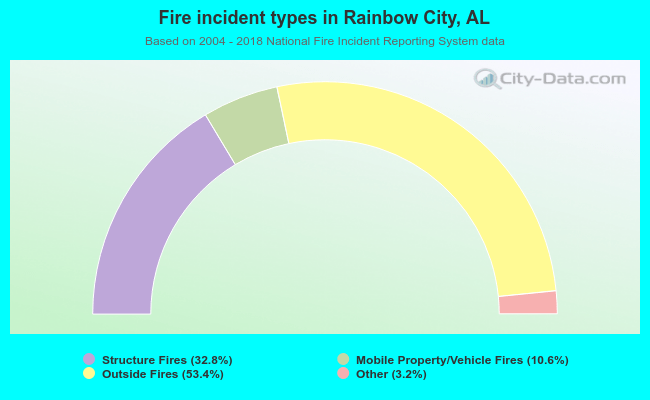 When looking into fire subcategories, the most reports belonged to: Outside Fires (53.4%), and Structure Fires (32.8%).