Arkansas City: Fire Incidents, Kansas (KS)
Where are fire incidents reported in Arkansas City, KS
Something went wrong! Please refresh the page.
| Fire incidents reported | |
|---|---|
| Sreet name | Count |
| SUMMIT | 168 |
| 2ND ST | 104 |
| 8TH ST | 86 |
| 6TH ST | 84 |
| B ST | 84 |
| US 166 HWY | 80 |
| C ST | 78 |
| 61ST RD | 66 |
| US 77 HWY | 66 |
| A ST | 64 |
| D ST | 60 |
| F ST | 60 |
| SUMMIT ST | 60 |
| 4TH ST | 54 |
| 5TH ST | 54 |
| 7TH ST | 52 |
| CHESTNUT | 48 |
| 1ST ST | 46 |
| 312TH RD | 46 |
| 3RD ST | 46 |
| KANSAS | 46 |
| 141ST RD | 42 |
| SKYLINE | 42 |
| 252ND RD | 38 |
| KANSAS AVE | 38 |
| 9TH ST | 36 |
| 41ST RD | 34 |
| 296TH RD | 32 |
| BIRCH | 32 |
| MADISON | 30 |
| Other | 542 |
2002 - 2018 National Fire Incident Reporting System (NFIRS) incidents
- Incident types reported to NFIRS in Arkansas City, KS
- 6,47556.8%Rescue & EMS
- 2,31820.3%Fire
- 1,0219.0%Hazardous Condition
- 8317.3%Good Intent Call
- 4694.1%Service Call
- 2552.2%False Alarm
- 160.1%Overpressure Rupture
- 120.1%Special Incident
- Fire incident types reported to NFIRS in Arkansas City, KS
- 1,35458.4%Outside Fires
- 62126.8%Structure Fires
- 24010.4%Mobile Property/Vehicle Fires
- 1034.4%Other
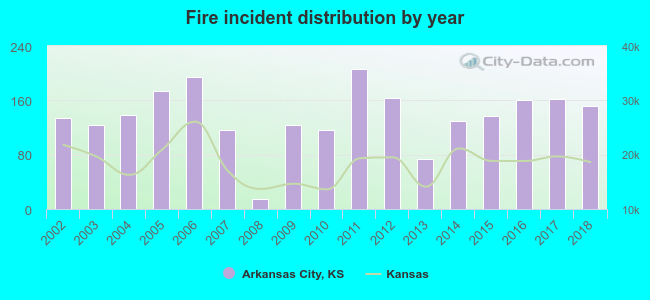 Based on the data from the years 2002 - 2018 the average number of fires per year is 136. The highest number of fire incidents - 206 took place in 2011, and the least - 15 in 2008. The data has an increasing trend.
The average number of yearly fire incidents per 10k residents in Arkansas City, KS compared to nearest cities:
(Note: Based on data for the last 3 years, including only cities with population 5,000 and above)
| Arkansas City: | 129.5 |
| Winfield: | 91.1 |
| Wellington: | 138.1 |
| Mulvane: | 130.9 |
| Derby: | 66.0 |
| Haysville: | 53.7 |
| Augusta: | 154.4 |
| Andover: | 51.4 |
| Wichita: | 48.0 |
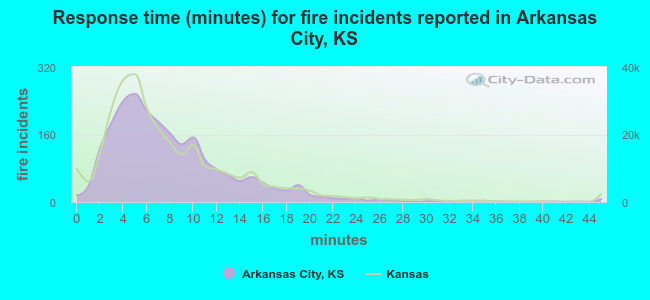 The median response time based on all reported fire incidents is 7 minutes. This is about the same as the state median value.
The median response time in Arkansas City, KS compared to nearest cities:
(Note: Based on data for all years, including only cities with at least 500 fire incidents)
| Arkansas City: | 7 minutes |
| Winfield: | 8 minutes |
| Udall: | 8 minutes |
| Wellington: | 7 minutes |
| Belle Plaine: | 11 minutes |
| Mulvane: | 7 minutes |
| Douglass: | 10 minutes |
| Rose Hill: | 7 minutes |
| Derby: | 5 minutes |
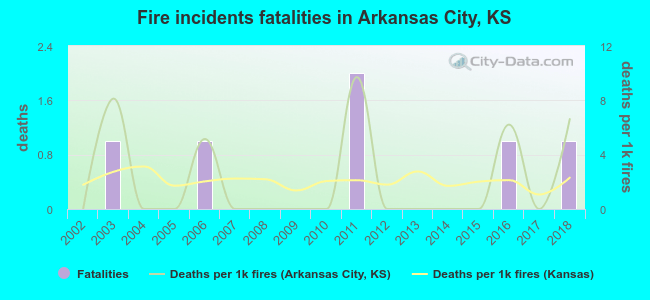 Based on the reports from the years 2002 - 2018 the average number of fire-related fatalities per year is 0. The highest number of deaths - 2 took place in 2011, and the lowest - 0 in 2002. The data has a growing trend.
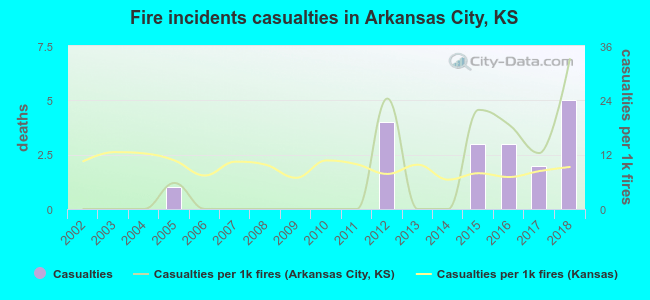 According to the data from the years 2002 - 2018 the average number of fire-related yearly casualties is 1. The highest number of reported casualties - 5 took place in 2018, and the lowest - 0 in 2002. The data has a growing trend.
The average number of injuries per 1,000 fire incidents is 7. This indicator was the highest - 33 in 2018, and the lowest 0 in 2002. The trend for injuries per 1,000 incidents is growing. Compared to the Kansas value the number of injuries per 1,000 fire incidents is similar.
According to the data from the years 2002 - 2018 the average number of fire-related yearly casualties is 1. The highest number of reported casualties - 5 took place in 2018, and the lowest - 0 in 2002. The data has a growing trend.
The average number of injuries per 1,000 fire incidents is 7. This indicator was the highest - 33 in 2018, and the lowest 0 in 2002. The trend for injuries per 1,000 incidents is growing. Compared to the Kansas value the number of injuries per 1,000 fire incidents is similar.Casualties per 1,000 incidents in Arkansas City, KS compared to nearest cities:
(Note: Based on data for all years, including only cities with at least 500 fire incidents)
| Arkansas City: | 7.8 |
| Winfield: | 7.0 |
| Udall: | 0.0 |
| Wellington: | 4.8 |
| Belle Plaine: | 0.0 |
| Mulvane: | 6.8 |
| Douglass: | 0.0 |
| Rose Hill: | 10.7 |
| Derby: | 5.7 |
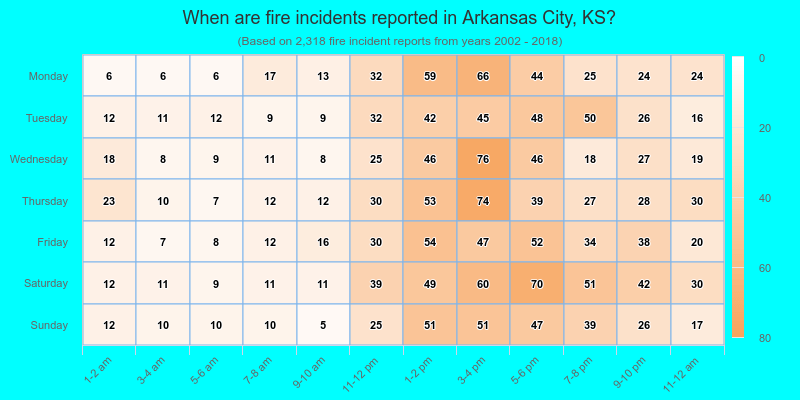
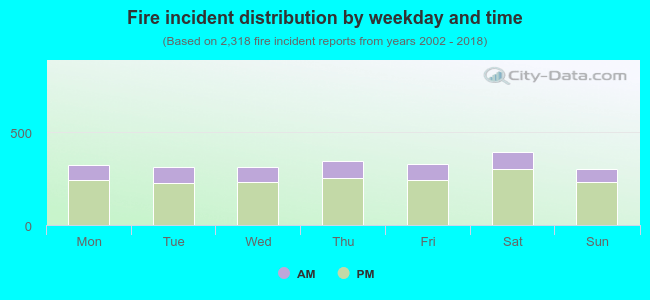 25.4% incidents where reported in the morning and 74.6% in the evening. The most fires (17.0%) took place on Saturday, and the least (13.1%) on Sunday.
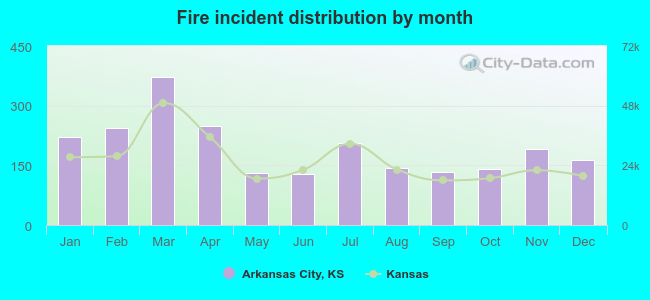 Based on the 2,318 fires from years 2002 - 2018 most fires (16.0%) took place during March, and the least (5.5%) in June.
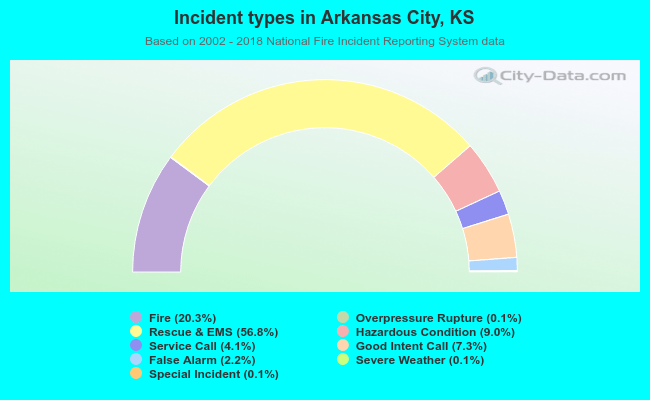 Out of all 11,406 cases reported during the years 2002 - 2018, the most belonged to the categories: Rescue & EMS (56.8%), Fire (20.3%), and Hazardous Condition (9.0%).
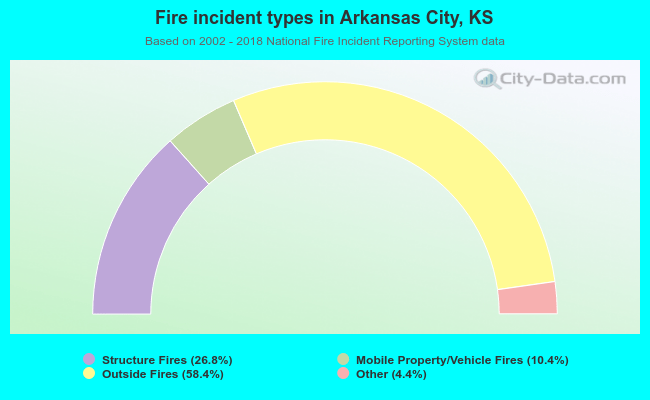 When looking into fire subcategories, the most incidents belonged to: Outside Fires (58.4%), and Structure Fires (26.8%).