Derby: Fire Incidents, Kansas (KS)
Where are fire incidents reported in Derby, KS
Something went wrong! Please refresh the page.
| Fire incidents reported | |
|---|---|
| Sreet name | Count |
| ROCK RD | 216 |
| 63RD ST | 126 |
| 47TH ST | 102 |
| 127TH ST | 100 |
| 55TH ST | 100 |
| 87TH ST | 100 |
| GREENWICH RD | 80 |
| BALTIMORE AV | 74 |
| WOODLAWN BV | 74 |
| 143RD ST | 72 |
| 79TH ST | 72 |
| 95TH ST | 72 |
| WESTVIEW DR | 70 |
| DERBY AV | 68 |
| OSAGE RD | 60 |
| MADISON AV | 58 |
| 71ST ST | 56 |
| BUCKNER ST | 52 |
| JAMES ST | 50 |
| 159TH ST | 48 |
| TALL TREE RD | 48 |
| NELSON DR | 46 |
| PATRIOT AV | 44 |
| KAY ST | 36 |
| LAKEVIEW DR | 36 |
| OLIVER ST | 36 |
| WEBB RD | 36 |
| KOKOMO AV | 30 |
| 103RD ST | 28 |
| K15 HWY | 28 |
| Other | 255 |
2002 - 2018 National Fire Incident Reporting System (NFIRS) incidents
- Incident types reported to NFIRS in Derby, KS
- 8,04652.2%Rescue & EMS
- 2,27314.7%Fire
- 1,55110.1%Hazardous Condition
- 1,3829.0%Service Call
- 1,3438.7%Good Intent Call
- 6454.2%False Alarm
- 1130.7%Special Incident
- 390.3%Overpressure Rupture
- 250.2%Severe Weather
- Fire incident types reported to NFIRS in Derby, KS
- 1,18752.2%Outside Fires
- 81035.6%Structure Fires
- 23810.5%Mobile Property/Vehicle Fires
- 381.7%Other
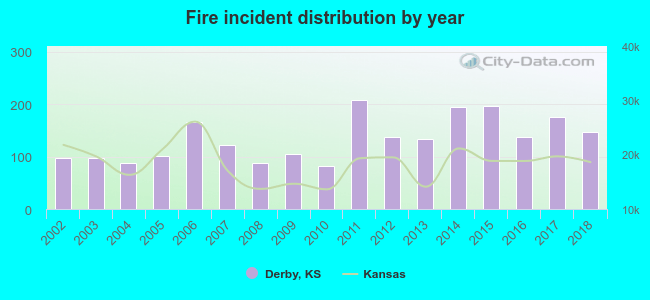 Based on the data from the years 2002 - 2018 the average number of fires per year is 134. The highest number of fire incidents - 207 took place in 2011, and the least - 81 in 2010. The data has an increasing trend.
The average number of yearly fire incidents per 10k residents in Derby, KS compared to nearest cities:
(Note: Based on data for the last 3 years, including only cities with population 5,000 and above)
| Derby: | 66.0 |
| Haysville: | 53.7 |
| Mulvane: | 130.9 |
| Wichita: | 48.0 |
| Andover: | 51.4 |
| Bel Aire: | 17.4 |
| Park City: | 41.9 |
| Augusta: | 154.4 |
| Valley Center: | 119.5 |
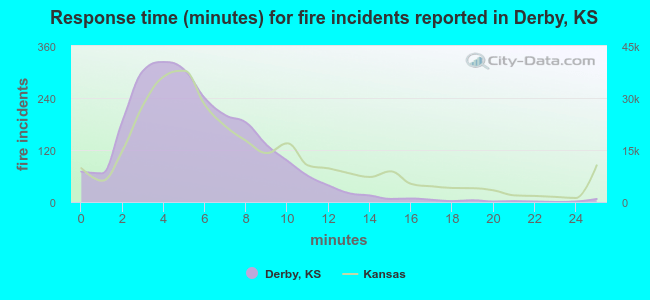 The median response time based on all reported fire incidents is 5 minutes. This is lower than the Kansas median value.
The median response time in Derby, KS compared to nearest cities:
(Note: Based on data for all years, including only cities with at least 500 fire incidents)
| Derby: | 5 minutes |
| Haysville: | 6 minutes |
| Mulvane: | 7 minutes |
| Rose Hill: | 7 minutes |
| Wichita: | 4 minutes |
| Belle Plaine: | 11 minutes |
| Andover: | 5 minutes |
| Clearwater: | 9 minutes |
| Udall: | 8 minutes |
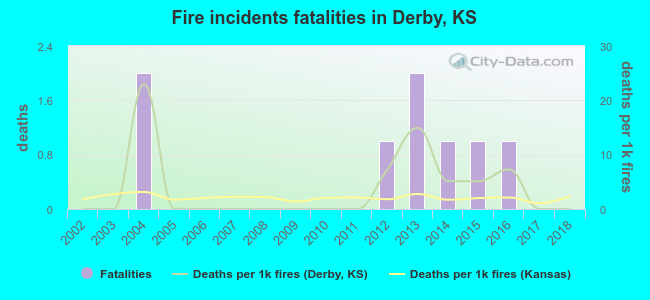 Based on the reports from the years 2002 - 2018 the average number of fire-related fatalities per year is 0. The highest number of reported deaths - 2 took place in 2004, and the lowest - 0 in 2002. The data has a constant trend.
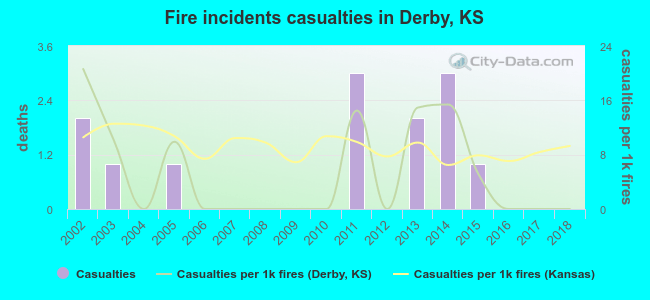 According to the data from the years 2002 - 2018 the average number of fire-related casualties per year is 1. The highest number of casualties - 3 took place in 2011, and the lowest - 0 in 2004. The data has a decreasing trend.
The average number of injuries per 1,000 fires is 5. This indicator was the highest - 21 in 2002, and the lowest 0 in 2004. The trend for casualties per 1,000 incidents is decreasing. Compared to the Kansas value the number of casualties per 1,000 fire incidents is lower.
According to the data from the years 2002 - 2018 the average number of fire-related casualties per year is 1. The highest number of casualties - 3 took place in 2011, and the lowest - 0 in 2004. The data has a decreasing trend.
The average number of injuries per 1,000 fires is 5. This indicator was the highest - 21 in 2002, and the lowest 0 in 2004. The trend for casualties per 1,000 incidents is decreasing. Compared to the Kansas value the number of casualties per 1,000 fire incidents is lower.Casualties per 1,000 incidents in Derby, KS compared to nearest cities:
(Note: Based on data for all years, including only cities with at least 500 fire incidents)
| Derby: | 5.7 |
| Haysville: | 16.6 |
| Mulvane: | 6.8 |
| Rose Hill: | 10.7 |
| Wichita: | 20.3 |
| Belle Plaine: | 0.0 |
| Andover: | 20.5 |
| Clearwater: | 12.1 |
| Udall: | 0.0 |
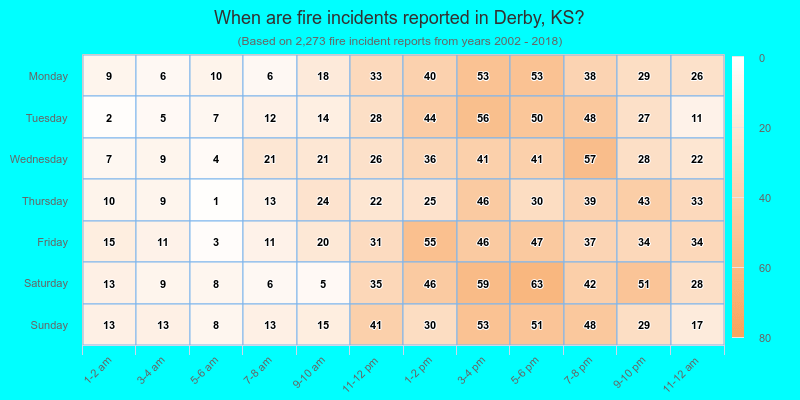
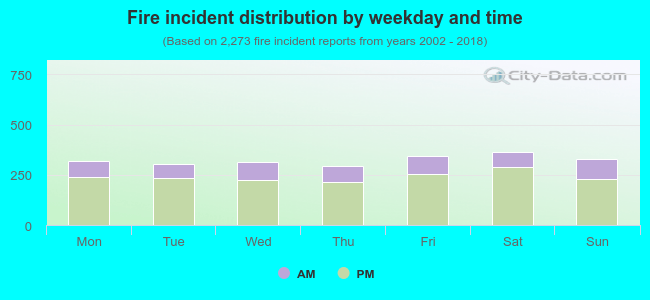 25.8% incidents where reported in the morning and 74.2% in the evening. The most fires (16.1%) took place on Saturday, and the least (13.0%) on Thursday.
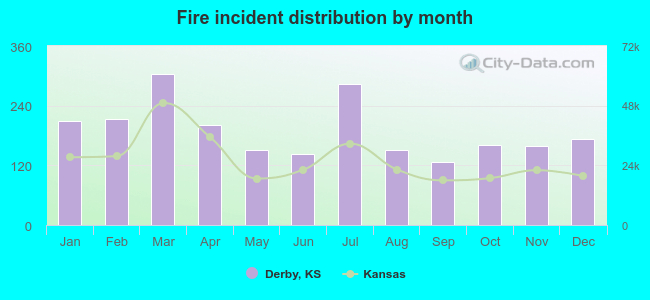 According to the 2,273 fire incidents from years 2002 - 2018 most fires (13.3%) took place during March, and the least (5.5%) in September.
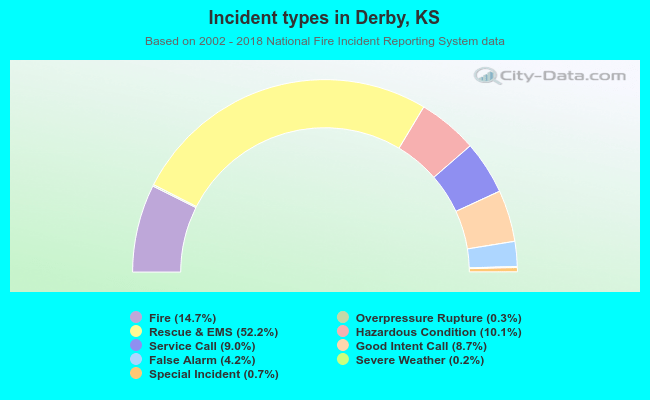 Out of all 15,417 cases reported during the years 2002 - 2018, the most belonged to the categories: Rescue & EMS (52.2%), Fire (14.7%), and Hazardous Condition (10.1%).
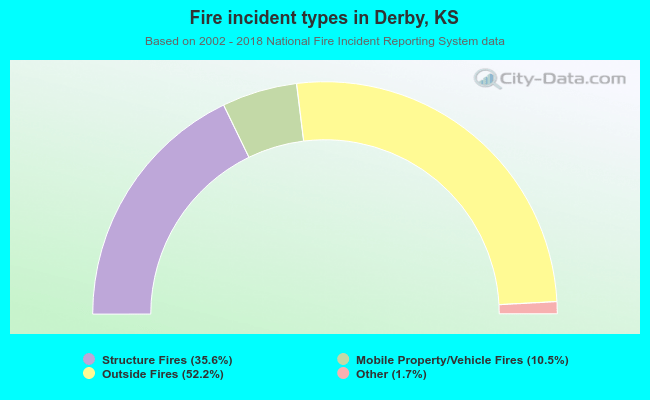 When looking into fire subcategories, the most reports belonged to: Outside Fires (52.2%), and Structure Fires (35.6%).