Arlington Heights: Fire Incidents, Illinois (IL)
Where are fire incidents reported in Arlington Heights, IL
Something went wrong! Please refresh the page.
| Fire incidents reported | |
|---|---|
| Sreet name | Count |
| NICHOLS RD | 266 |
| RAND RD | 194 |
| ARLINGTON HEIGHTS RD | 164 |
| ALGONQUIN RD | 124 |
| CENTRAL RD | 122 |
| GOLF RD | 92 |
| PALATINE RD | 70 |
| GOEBBERT RD | 64 |
| KENNICOTT AV | 58 |
| BONHILL DR | 54 |
| DUNDEE RD | 50 |
| OUT OF DISTRICT | 50 |
| OAKTON | 46 |
| BELMONT AV | 44 |
| HIGHLAND AV | 44 |
| EUCLID AV | 40 |
| CAMPBELL ST | 36 |
| OAKTON ST | 36 |
| WINDSOR DR | 36 |
| I90 | 34 |
| MINER ST | 34 |
| NORTHWEST HWY | 34 |
| VAIL AV | 34 |
| BURR OAK DR | 32 |
| EUCLID AVE | 32 |
| BLOOMINGTON AV | 30 |
| DRYDEN AV | 30 |
| EVERGREEN AV | 30 |
| FERNANDEZ AV | 28 |
| OLIVE ST | 28 |
| Other | 40 |
2002 - 2018 National Fire Incident Reporting System (NFIRS) incidents
- Incident types reported to NFIRS in Arlington Heights, IL
- 10,59547.5%Rescue & EMS
- 3,59016.1%Hazardous Condition
- 2,42710.9%False Alarm
- 2,26610.2%Good Intent Call
- 1,9768.9%Fire
- 1,3726.2%Service Call
- 390.2%Overpressure Rupture
- Fire incident types reported to NFIRS in Arlington Heights, IL
- 92847.0%Structure Fires
- 69335.1%Outside Fires
- 30015.2%Mobile Property/Vehicle Fires
- 552.8%Other
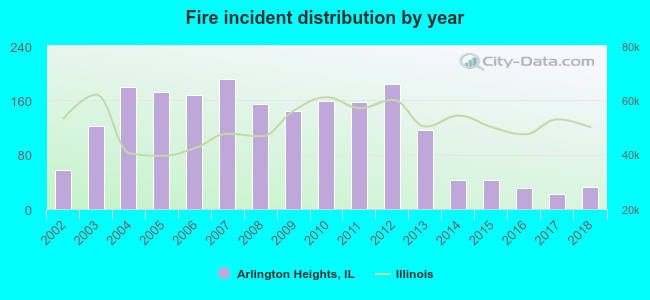 According to the data from the years 2002 - 2018 the average number of fire incidents per year is 116. The highest number of reported fire incidents - 191 took place in 2007, and the least - 22 in 2017. The data has a decreasing trend.
The average number of yearly fire incidents per 10k residents in Arlington Heights, IL compared to nearest cities:
(Note: Based on data for the last 3 years, including only cities with population 5,000 and above)
| Arlington Heights: | 3.7 |
| Rolling Meadows: | 23.9 |
| Prospect Heights: | 27.4 |
| Mount Prospect: | 18.4 |
| Palatine: | 20.6 |
| Wheeling: | 19.4 |
| Buffalo Grove: | 20.4 |
| Des Plaines: | 30.8 |
| Inverness: | 18.9 |
 The median response time based on all reported fire incidents is 5 minutes. This is comparable to the Illinois median value.
The median response time in Arlington Heights, IL compared to nearest cities:
(Note: Based on data for all years, including only cities with at least 500 fire incidents)
| Arlington Heights: | 5 minutes |
| Rolling Meadows: | 5 minutes |
| Prospect Heights: | 5 minutes |
| Mount Prospect: | 5 minutes |
| Palatine: | 5 minutes |
| Wheeling: | 5 minutes |
| Buffalo Grove: | 5 minutes |
| Des Plaines: | 5 minutes |
| Elk Grove Village: | 5 minutes |
 Based on the reports from the years 2002 - 2018 the average number of fire-related yearly deaths is 0. The highest number of reported deaths - 4 took place in 2009, and the lowest - 0 in 2002. The data has a constant trend.
 According to the reports from the years 2002 - 2018 the average number of fire-related casualties per year is 4. The highest number of reported casualties - 17 took place in 2011, and the lowest - 0 in 2006. The data has a decreasing trend.
The average number of casualties per 1,000 fire incidents is 27. This indicator was the highest - 108 in 2011, and the lowest 0 in 2006. The trend for casualties per 1,000 incidents is dropping. Compared to the state value the number of casualties per 1,000 incidents is much higher.
According to the reports from the years 2002 - 2018 the average number of fire-related casualties per year is 4. The highest number of reported casualties - 17 took place in 2011, and the lowest - 0 in 2006. The data has a decreasing trend.
The average number of casualties per 1,000 fire incidents is 27. This indicator was the highest - 108 in 2011, and the lowest 0 in 2006. The trend for casualties per 1,000 incidents is dropping. Compared to the state value the number of casualties per 1,000 incidents is much higher.Casualties per 1,000 incidents in Arlington Heights, IL compared to nearest cities:
(Note: Based on data for all years, including only cities with at least 500 fire incidents)
| Arlington Heights: | 31.4 |
| Rolling Meadows: | 19.4 |
| Prospect Heights: | 20.1 |
| Mount Prospect: | 28.0 |
| Palatine: | 16.4 |
| Wheeling: | 57.3 |
| Buffalo Grove: | 19.4 |
| Des Plaines: | 37.0 |
| Elk Grove Village: | 14.2 |
 32.0% incidents where reported in the morning and 68.0% in the evening. The most fires (16.5%) took place on Tuesday, and the least (11.9%) on Wednesday.
 Based on the 1,976 fires from years 2002 - 2018 most fires (10.8%) took place during July, and the least (5.1%) in February.
 Out of all 22,290 cases reported during the years 2002 - 2018, the most belonged to the categories: Rescue & EMS (47.5%), Hazardous Condition (16.1%), and False Alarm (10.9%).
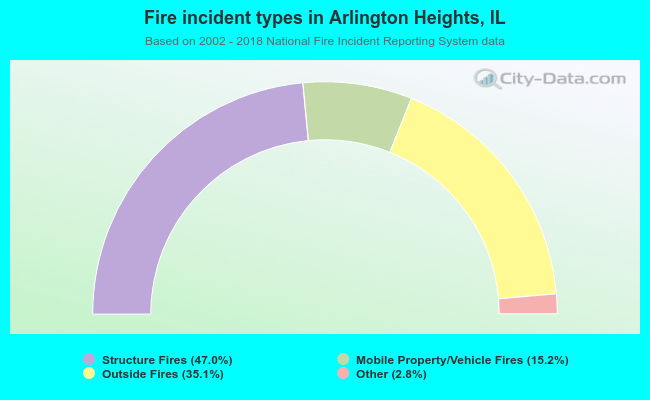 When looking into fire subcategories, the most reports belonged to: Structure Fires (47.0%), and Outside Fires (35.1%).