Inverness: Fire Incidents, Illinois (IL)
Where are fire incidents reported in Inverness, IL
Something went wrong! Please refresh the page.
|
| |||||||||||||||||||||||||||||||||||||||||||||||||||||||||||||||||||||||||||||||||||||||||||||||||||||||||||||
2002 - 2018 National Fire Incident Reporting System (NFIRS) incidents
- Incident types reported to NFIRS in Inverness, IL
- 2,67951.9%Rescue & EMS
- 77114.9%False Alarm
- 56611.0%Good Intent Call
- 55210.7%Hazardous Condition
- 3667.1%Fire
- 2074.0%Service Call
- 90.2%Severe Weather
- 80.2%Overpressure Rupture
- Fire incident types reported to NFIRS in Inverness, IL
- 25770.2%Structure Fires
- 7119.4%Outside Fires
- 215.7%Mobile Property/Vehicle Fires
- 174.6%Other
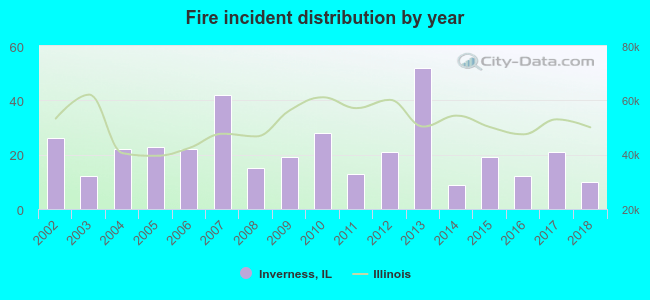 According to the data from the years 2002 - 2018 the average number of fire incidents per year is 22. The highest number of fire incidents - 52 took place in 2013, and the least - 9 in 2014. The data has a declining trend.
The average number of yearly fire incidents per 10k residents in Inverness, IL compared to nearest cities:
(Note: Based on data for the last 3 years, including only cities with population 5,000 and above)
| Inverness: | 18.9 |
| Palatine: | 20.6 |
| Barrington: | 52.1 |
| Hoffman Estates: | 20.1 |
| Rolling Meadows: | 23.9 |
| Lake Zurich: | 28.1 |
| Schaumburg: | 18.3 |
| Arlington Heights: | 3.7 |
| Streamwood: | 21.8 |

 27.0% incidents where reported in the morning and 73.0% in the evening. The most fires (21.0%) took place on Thursday, and the least (9.0%) on Friday.
 According to the 366 incident reports from years 2002 - 2018 most fires (12.8%) took place during October, and the least (4.1%) in September.
 Out of all 5,158 cases reported during the years 2002 - 2018, the most belonged to the categories: Rescue & EMS (51.9%), False Alarm (14.9%), and Good Intent Call (11.0%).
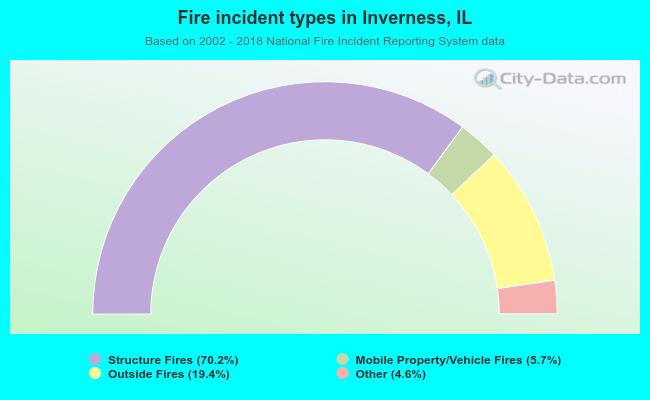 When looking into fire subcategories, the most reports belonged to: Structure Fires (70.2%), and Outside Fires (19.4%).