Atascocita: Fire Incidents, Texas (TX)
Where are fire incidents reported in Atascocita, TX
Something went wrong! Please refresh the page.
|
| |||||||||||||||||||||||||||||||||||||||||||||||||||||||||||||||||||||||||||||||||||||||||||||||||||||||||||||
2004 - 2018 National Fire Incident Reporting System (NFIRS) incidents
- Incident types reported to NFIRS in Atascocita, TX
- 15126.5%Rescue & EMS
- 14425.3%Fire
- 13423.5%Good Intent Call
- 10017.5%Hazardous Condition
- 244.2%False Alarm
- 152.6%Service Call
- 10.2%Overpressure Rupture
- 10.2%Special Incident
- Fire incident types reported to NFIRS in Atascocita, TX
- 6847.2%Structure Fires
- 4732.6%Outside Fires
- 1711.8%Other
- 128.3%Mobile Property/Vehicle Fires
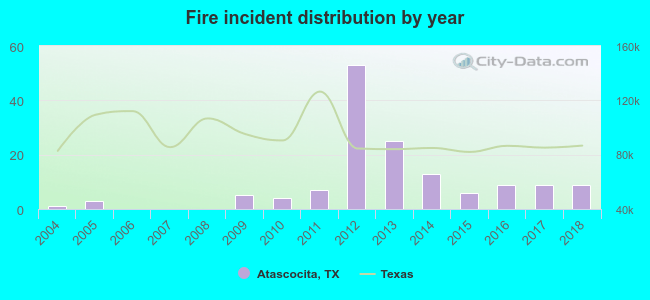 According to the data from the years 2004 - 2018 the average number of fires per year is 10. The highest number of fires - 53 took place in 2012, and the least - 0 in 2006. The data has a rising trend.
The average number of yearly fire incidents per 10k residents in Atascocita, TX compared to nearest cities:
(Note: Based on data for the last 3 years, including only cities with population 5,000 and above)
| Atascocita: | 1.4 |
| Humble: | 217.5 |
| Aldine: | 1.6 |
| Spring: | 113.9 |
| Highlands: | 192.3 |
| Cloverleaf: | 0.6 |
| Channelview: | 55.4 |
| Jacinto City: | 2.5 |
| Dayton: | 77.7 |
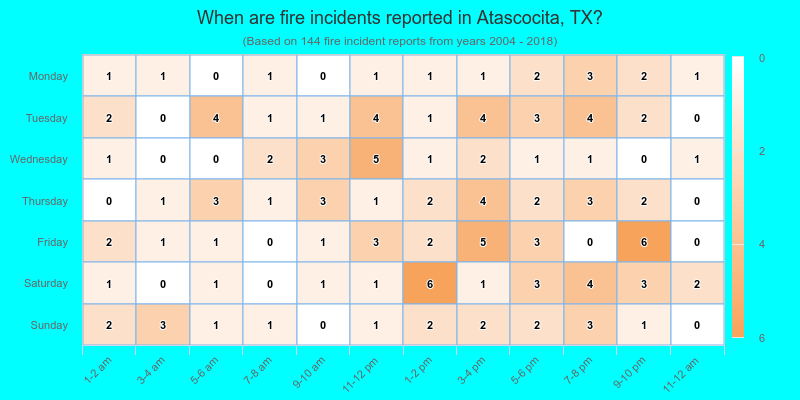
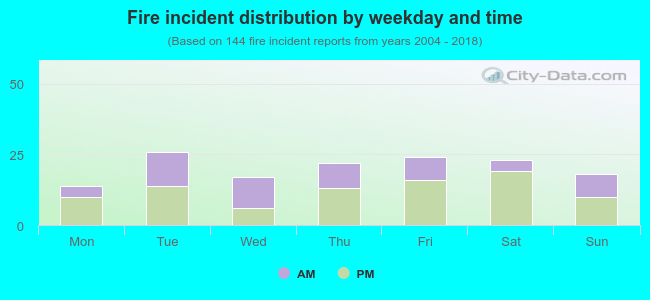 38.9% incidents where reported in the morning and 61.1% in the evening. The most fires (18.1%) took place on Tuesday, and the least (9.7%) on Monday.
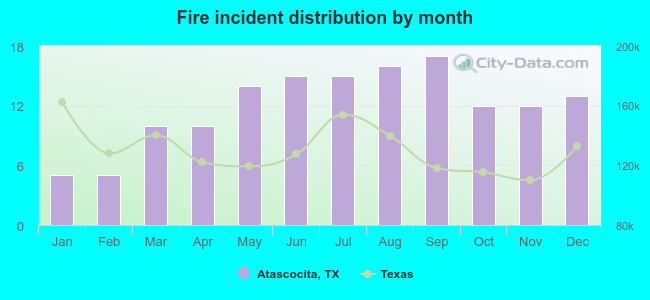 Based on the 144 incident reports from years 2004 - 2018 most fires (11.8%) took place during September, and the least (3.5%) in January.
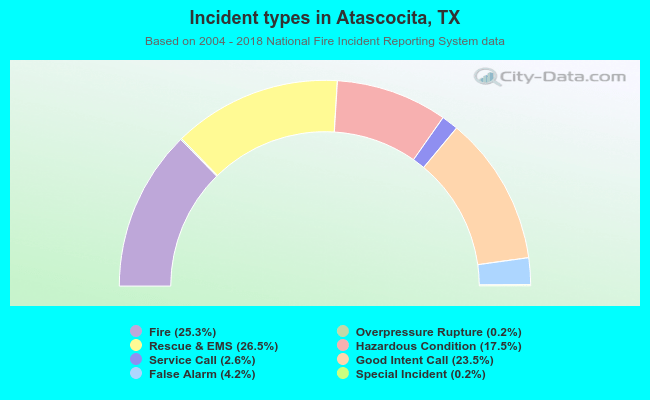 Out of all 570 cases reported during the years 2004 - 2018, the most belonged to the categories: Rescue & EMS (26.5%), Fire (25.3%), and Good Intent Call (23.5%).
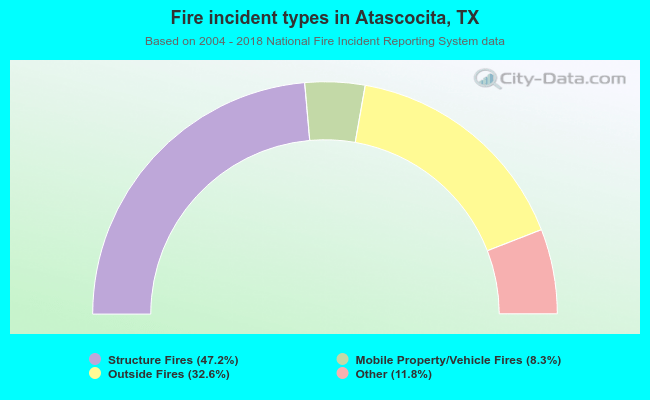 When looking into fire subcategories, the most reports belonged to: Structure Fires (47.2%), and Outside Fires (32.6%).