Atchison: Fire Incidents, Kansas (KS)
Where are fire incidents reported in Atchison, KS
Something went wrong! Please refresh the page.
| Fire incidents reported | |
|---|---|
| Sreet name | Count |
| COMMERCIAL ST | 70 |
| MAIN ST | 62 |
| ATCHISON ST | 46 |
| DIVISION ST | 44 |
| 2ND ST | 32 |
| N 2ND ST | 32 |
| SANTA FE ST | 32 |
| INDUSTRIAL RD | 30 |
| US 73 HWY | 28 |
| KANSAS AVE | 26 |
| N 4TH ST | 26 |
| 4TH ST | 24 |
| 5TH ST | 22 |
| 7TH ST | 22 |
| N 7TH ST | 22 |
| PARALLEL ST | 22 |
| 6TH ST | 20 |
| 8TH ST | 20 |
| 10TH ST | 16 |
| HARPER DR | 16 |
| RIVER RD | 16 |
| S 4TH ST | 16 |
| US 59 HWY | 16 |
| 286TH RD | 14 |
| HICKORY ST | 14 |
| M ST | 14 |
| MOUND ST | 14 |
| NEOSHO RD | 14 |
| RILEY ST | 14 |
| 274TH RD | 12 |
| Other | 6 |
2005 - 2018 National Fire Incident Reporting System (NFIRS) incidents
- Incident types reported to NFIRS in Atchison, KS
- 3,28151.8%Rescue & EMS
- 97515.4%Hazardous Condition
- 76212.0%Fire
- 4987.9%Service Call
- 4687.4%Good Intent Call
- 2844.5%False Alarm
- 300.5%Special Incident
- 260.4%Overpressure Rupture
- Fire incident types reported to NFIRS in Atchison, KS
- 33243.6%Structure Fires
- 28937.9%Outside Fires
- 13517.7%Mobile Property/Vehicle Fires
- 60.8%Other
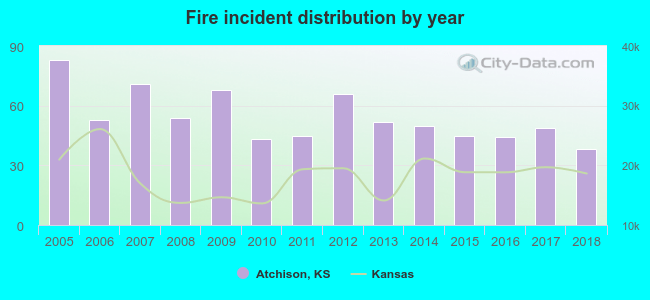 Based on the data from the years 2005 - 2018 the average number of fire incidents per year is 54. The highest number of fires - 83 took place in 2005, and the least - 38 in 2018. The data has a declining trend.
The average number of yearly fire incidents per 10k residents in Atchison, KS compared to nearest cities:
(Note: Based on data for the last 3 years, including only cities with population 5,000 and above)
| Atchison: | 40.5 |
| Leavenworth: | 51.2 |
| Lansing: | 30.2 |
| Basehor: | 108.7 |
| Tonganoxie: | 213.8 |
| Bonner Springs: | 50.3 |
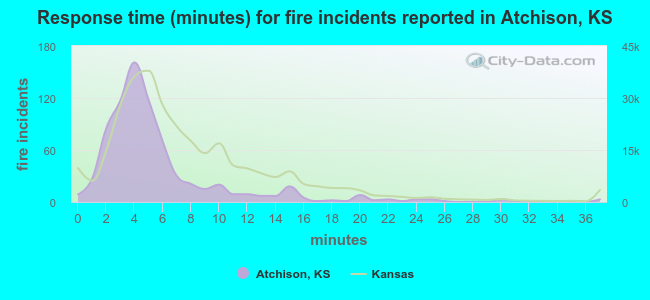 The median response time based on all reported fire incidents is 4 minutes. This is lower compared to the state median value.
The median response time in Atchison, KS compared to nearest cities:
(Note: Based on data for all years, including only cities with at least 500 fire incidents)
| Atchison: | 4 minutes |
| Leavenworth: | 4 minutes |
| Horton: | 9 minutes |
| Lansing: | 6 minutes |
| McLouth: | 12 minutes |
| Oskaloosa: | 12 minutes |
| Ozawkie: | 15 minutes |
| Hiawatha: | 7 minutes |
| Basehor: | 7 minutes |
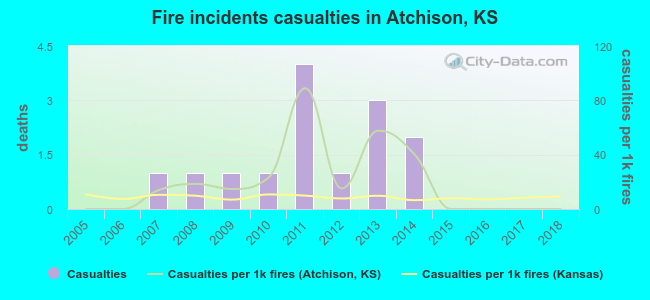 Based on the data from the years 2005 - 2018 the average number of fire-related yearly casualties is 1. The highest number of injuries - 4 took place in 2011, and the lowest - 0 in 2005. The data has a constant trend.
The average number of casualties per 1,000 fire incidents is 19. This indicator was the highest - 89 in 2011, and the lowest 0 in 2005. The trend for casualties per 1,000 fires is constant. Compared to the Kansas value the number of injuries per 1,000 fire incidents is higher.
Based on the data from the years 2005 - 2018 the average number of fire-related yearly casualties is 1. The highest number of injuries - 4 took place in 2011, and the lowest - 0 in 2005. The data has a constant trend.
The average number of casualties per 1,000 fire incidents is 19. This indicator was the highest - 89 in 2011, and the lowest 0 in 2005. The trend for casualties per 1,000 fires is constant. Compared to the Kansas value the number of injuries per 1,000 fire incidents is higher.
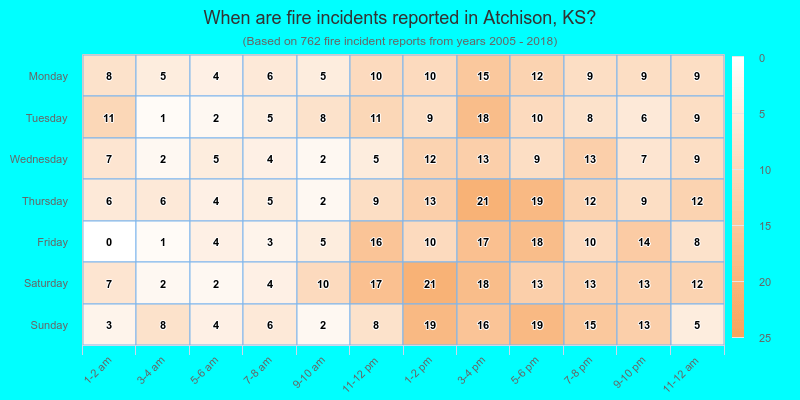
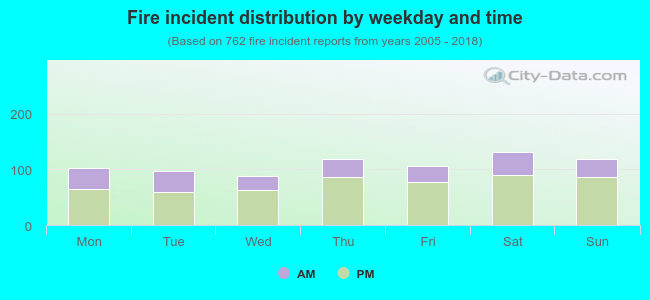 30.8% incidents where reported in the morning and 69.2% in the evening. The most fires (17.3%) took place on Saturday, and the least (11.5%) on Wednesday.
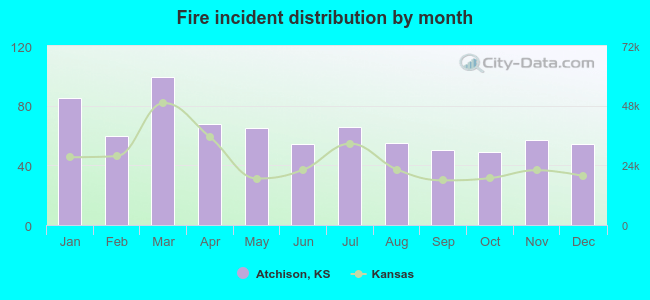 Based on the 762 incident reports from years 2005 - 2018 most fires (13.0%) took place during March, and the least (6.4%) in October.
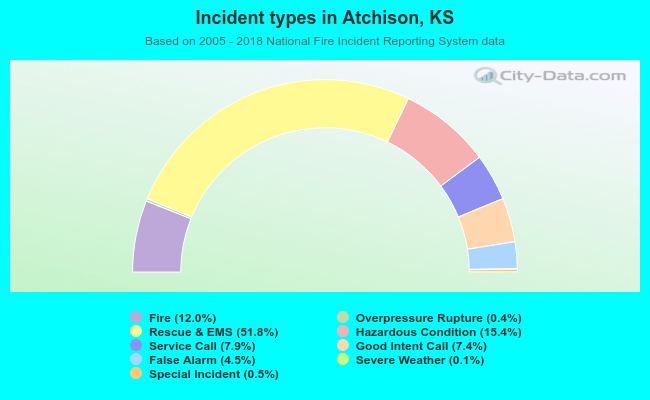 Out of all 6,329 cases reported during the years 2005 - 2018, the most belonged to the categories: Rescue & EMS (51.8%), Hazardous Condition (15.4%), and Fire (12.0%).
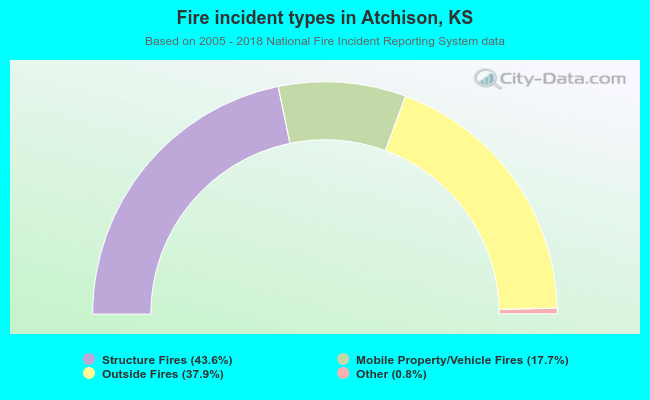 When looking into fire subcategories, the most reports belonged to: Structure Fires (43.6%), and Outside Fires (37.9%).