Hiawatha: Fire Incidents, Kansas (KS)
Where are fire incidents reported in Hiawatha, KS
Something went wrong! Please refresh the page.
|
| |||||||||||||||||||||||||||||||||||||||||||||||||||||||||||||||||||||||||||||||||||||||||||||||||||||||||||||
2002 - 2018 National Fire Incident Reporting System (NFIRS) incidents
- Incident types reported to NFIRS in Hiawatha, KS
- 61144.4%Fire
- 32023.3%Hazardous Condition
- 20014.5%Good Intent Call
- 886.4%Rescue & EMS
- 695.0%False Alarm
- 372.7%Service Call
- 342.5%Special Incident
- 120.9%Severe Weather
- 40.3%Overpressure Rupture
- Fire incident types reported to NFIRS in Hiawatha, KS
- 33855.3%Outside Fires
- 15725.7%Structure Fires
- 8614.1%Mobile Property/Vehicle Fires
- 304.9%Other
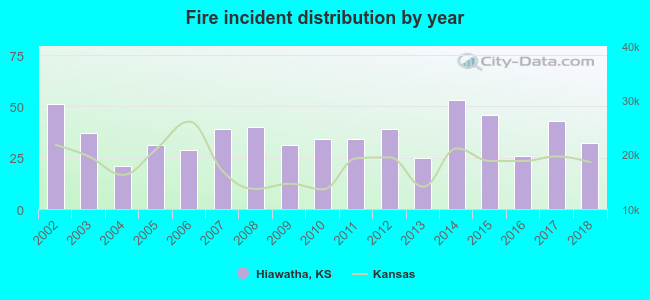 According to the data from the years 2002 - 2018 the average number of fires per year is 36. The highest number of fires - 53 took place in 2014, and the least - 21 in 2004. The data has a dropping trend.
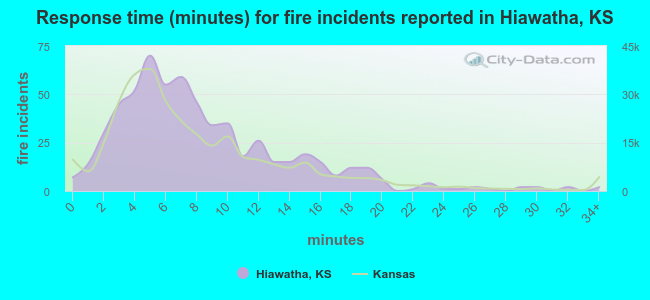 The median response time based on all reported fire incidents is 7 minutes. This is comparable to the Kansas median value.
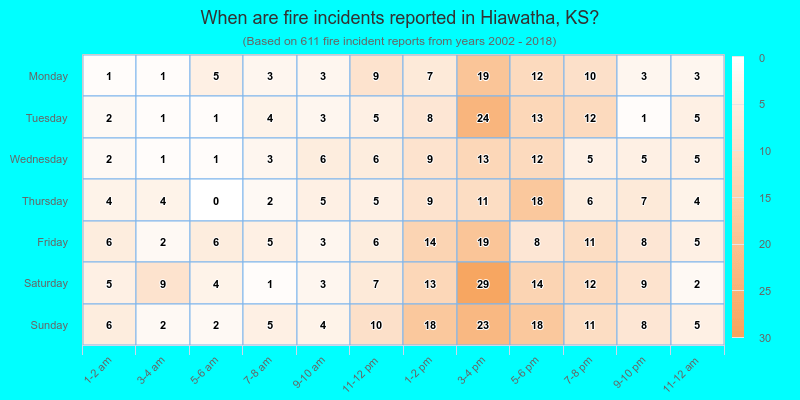
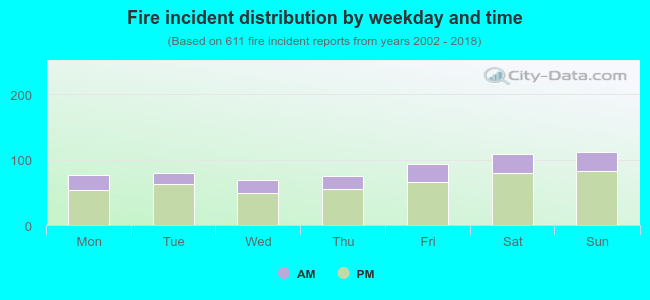 26.7% incidents where reported in the morning and 73.3% in the evening. The most fires (18.3%) took place on Sunday, and the least (11.1%) on Wednesday.
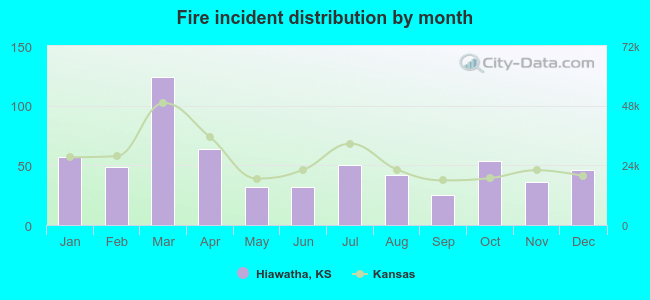 Based on the 611 fires from years 2002 - 2018 most fires (20.3%) took place during March, and the least (4.1%) in September.
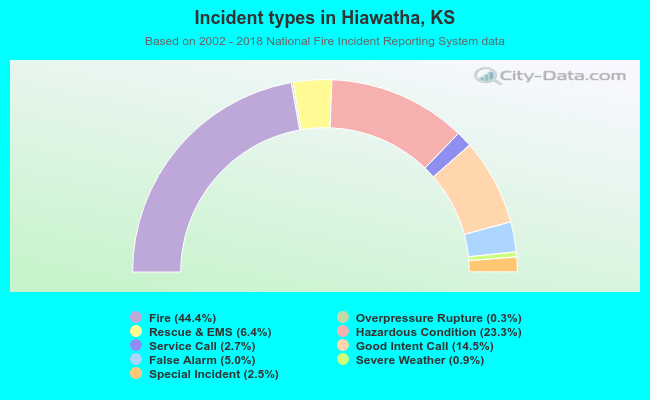 Out of all 1,375 cases reported during the years 2002 - 2018, the most belonged to the categories: Fire (44.4%), Hazardous Condition (23.3%), and Good Intent Call (14.5%).
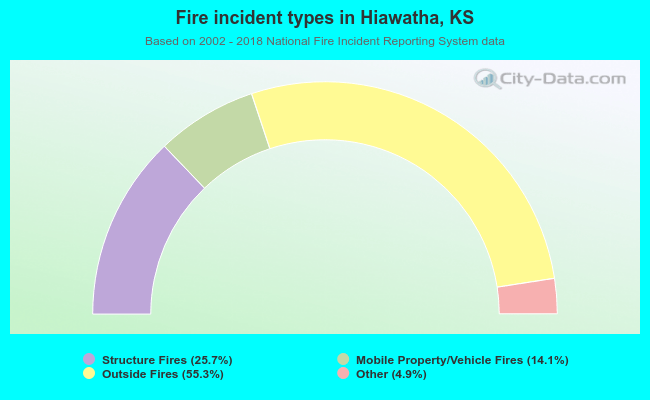 When looking into fire subcategories, the most reports belonged to: Outside Fires (55.3%), and Structure Fires (25.7%).