Auburn: Fire Incidents, New York (NY)
Where are fire incidents reported in Auburn, NY
Something went wrong! Please refresh the page.
| Fire incidents reported | |
|---|---|
| Sreet name | Count |
| GENESEE ST | 176 |
| CLARK STREET RD | 112 |
| GRANT AVE | 82 |
| STATE ST | 64 |
| NORTH ST | 60 |
| SEYMOUR ST | 58 |
| CLARK ST | 44 |
| EASTLAKE ROAD | 42 |
| FRANKLIN ST | 42 |
| ORCHARD ST | 40 |
| SOUTH ST | 40 |
| TURNPIKE RD | 40 |
| DIVISION ST | 38 |
| WASHINGTON ST | 38 |
| CLARK ST RD | 36 |
| OWASCO ROAD | 34 |
| WALL ST | 32 |
| OSBORNE ST | 30 |
| OWASCO ST | 30 |
| WEST GENESEE STREET ROAD RD | 30 |
| FULTON ST | 28 |
| QUILL AVE | 28 |
| CLARK STREET RD | 26 |
| LAKE AVE | 26 |
| PERRINE ST | 26 |
| ROUTE 34 | 26 |
| MELROSE ROAD | 24 |
| COTTAGE ST | 22 |
| STATE ST RD | 22 |
| ARTERIAL | 20 |
| Other | 599 |
2002 - 2018 National Fire Incident Reporting System (NFIRS) incidents
- Incident types reported to NFIRS in Auburn, NY
- 20,69354.6%Rescue & EMS
- 6,19016.3%Service Call
- 4,55812.0%Hazardous Condition
- 2,3806.3%Good Intent Call
- 2,0005.3%False Alarm
- 1,9155.1%Fire
- 620.2%Special Incident
- 610.2%Severe Weather
- Fire incident types reported to NFIRS in Auburn, NY
- 98751.5%Structure Fires
- 55929.2%Outside Fires
- 1859.7%Other
- 1849.6%Mobile Property/Vehicle Fires
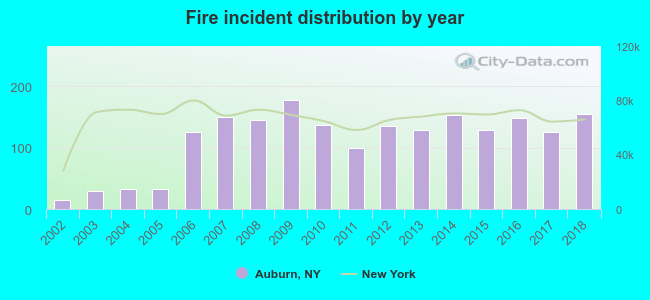 According to the data from the years 2002 - 2018 the average number of fires per year is 113. The highest number of reported fires - 177 took place in 2009, and the least - 15 in 2002. The data has a growing trend.
The average number of yearly fire incidents per 10k residents in Auburn, NY compared to nearest cities:
(Note: Based on data for the last 3 years, including only cities with population 5,000 and above)
| Auburn: | 52.8 |
| Seneca Falls: | 77.4 |
| Waterloo: | 97.7 |
| Fairmount: | 1.0 |
| Onondaga: | 3.9 |
| Baldwinsville: | 90.7 |
| Solvay: | 38.7 |
| Lysander: | 1.4 |
| Geneva: | 50.2 |
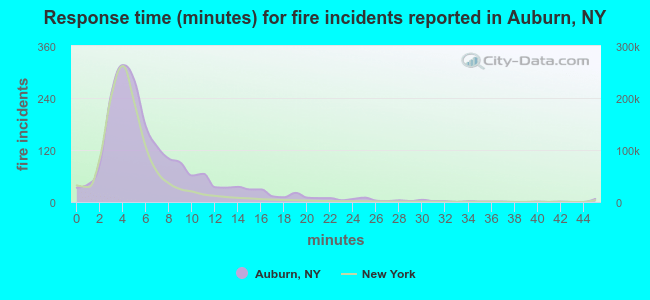 The median response time based on all reported fire incidents is 5 minutes. This is higher than the state median value.
The median response time in Auburn, NY compared to nearest cities:
(Note: Based on data for all years, including only cities with at least 500 fire incidents)
| Auburn: | 5 minutes |
| Skaneateles: | 11 minutes |
| Seneca Falls: | 5 minutes |
| Camillus: | 7 minutes |
| Waterloo: | 5 minutes |
| Moravia: | 11 minutes |
| Baldwinsville: | 8 minutes |
| Liverpool: | 7 minutes |
| Geneva: | 2 minutes |
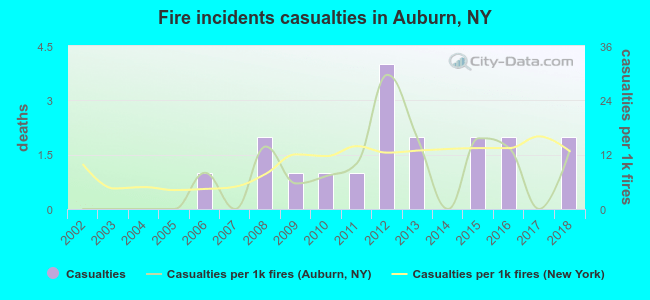 Based on the reports from the years 2002 - 2018 the average number of fire-related yearly casualties is 1. The highest number of injuries - 4 took place in 2012, and the lowest - 0 in 2002. The data has a rising trend.
The average number of injuries per 1,000 fire incidents is 8. This indicator was the highest - 30 in 2012, and the lowest 0 in 2002. The trend for injuries per 1,000 fires is rising. Compared to the New York value the number of casualties per 1,000 fire incidents is about the same.
Based on the reports from the years 2002 - 2018 the average number of fire-related yearly casualties is 1. The highest number of injuries - 4 took place in 2012, and the lowest - 0 in 2002. The data has a rising trend.
The average number of injuries per 1,000 fire incidents is 8. This indicator was the highest - 30 in 2012, and the lowest 0 in 2002. The trend for injuries per 1,000 fires is rising. Compared to the New York value the number of casualties per 1,000 fire incidents is about the same.Casualties per 1,000 incidents in Auburn, NY compared to nearest cities:
(Note: Based on data for all years, including only cities with at least 500 fire incidents)
| Auburn: | 9.4 |
| Skaneateles: | 0.0 |
| Seneca Falls: | 0.0 |
| Camillus: | 1.4 |
| Waterloo: | 3.3 |
| Moravia: | 0.0 |
| Baldwinsville: | 11.0 |
| Liverpool: | 13.0 |
| Geneva: | 7.5 |
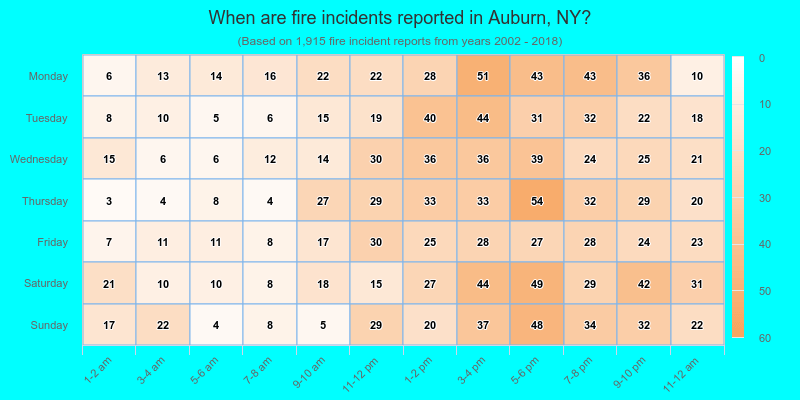
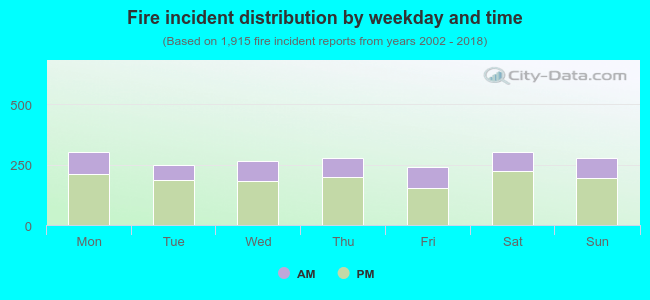 29.5% incidents where reported in the morning and 70.5% in the evening. The most fires (15.9%) took place on Monday, and the least (12.5%) on Friday.
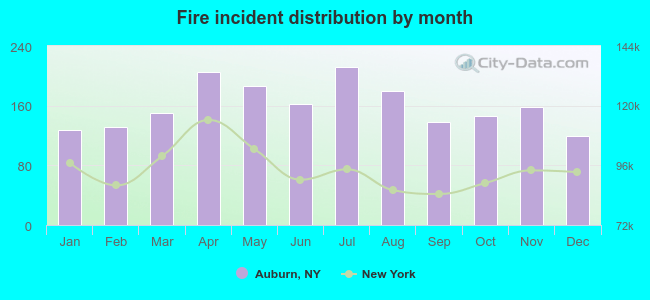 According to the 1,915 fires from years 2002 - 2018 most fires (11.1%) took place during July, and the least (6.3%) in December.
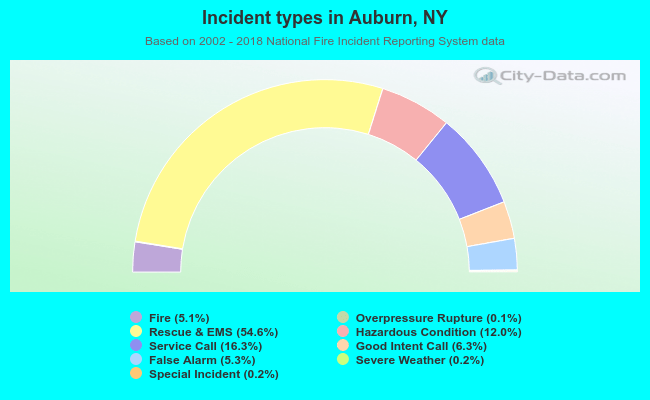 Out of all 37,890 cases reported during the years 2002 - 2018, the most belonged to the categories: Rescue & EMS (54.6%), Service Call (16.3%), and Hazardous Condition (12.0%).
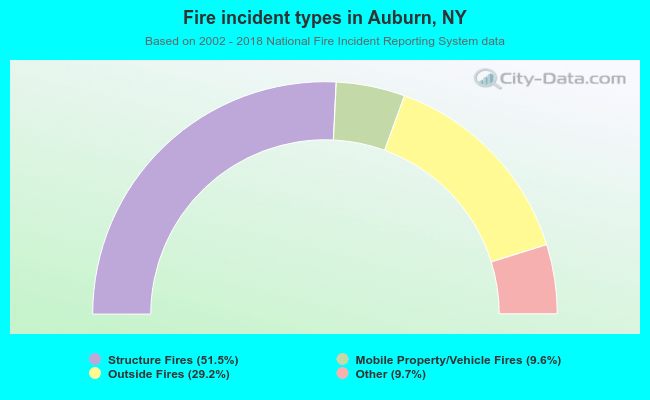 When looking into fire subcategories, the most reports belonged to: Structure Fires (51.5%), and Outside Fires (29.2%).