Solvay: Fire Incidents, New York (NY)
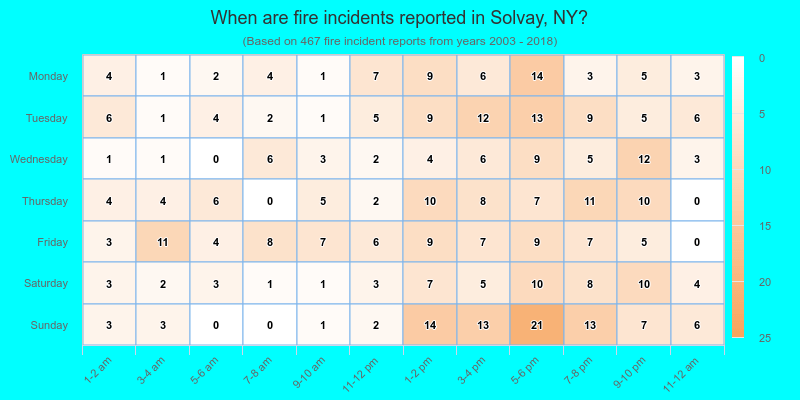
Where are fire incidents reported in Solvay, NY
Something went wrong! Please refresh the page.
|
| |||||||||||||||||||||||||||||||||||||||||||||||||||||||||||||||||||||||||||||||||||||||||||||||||||||||||||||
2003 - 2018 National Fire Incident Reporting System (NFIRS) incidents
- Incident types reported to NFIRS in Solvay, NY
- 1,62544.1%Rescue & EMS
- 46712.7%Fire
- 45212.3%Good Intent Call
- 44312.0%Hazardous Condition
- 3569.7%False Alarm
- 3298.9%Service Call
- 80.2%Special Incident
- 60.2%Overpressure Rupture
- Fire incident types reported to NFIRS in Solvay, NY
- 24953.3%Structure Fires
- 12025.7%Outside Fires
- 6513.9%Mobile Property/Vehicle Fires
- 337.1%Other
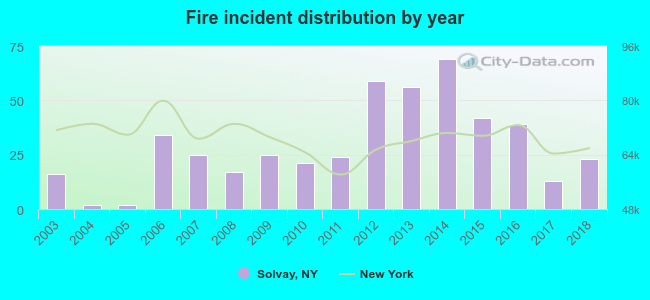 According to the data from the years 2003 - 2018 the average number of fires per year is 29. The highest number of fire incidents - 69 took place in 2014, and the least - 2 in 2004. The data has a growing trend.
The average number of yearly fire incidents per 10k residents in Solvay, NY compared to nearest cities:
(Note: Based on data for the last 3 years, including only cities with population 5,000 and above)
| Solvay: | 38.7 |
| Fairmount: | 1.0 |
| Syracuse: | 77.4 |
| Mattydale: | 63.1 |
| Onondaga: | 3.9 |
| Clay: | 6.6 |
| North Syracuse: | 96.9 |
| De Witt: | 14.3 |
| Baldwinsville: | 90.7 |
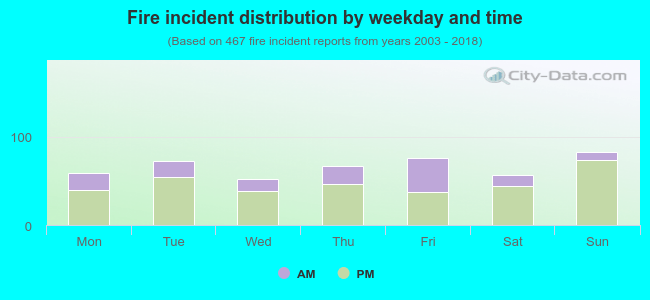 28.5% incidents where reported in the morning and 71.5% in the evening. The most fires (17.8%) took place on Sunday, and the least (11.1%) on Wednesday.
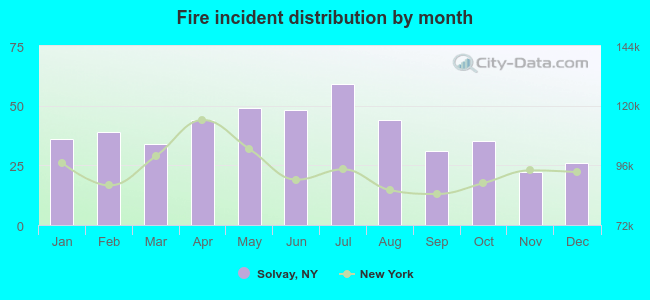 Based on the 467 reports from years 2003 - 2018 most fires (12.6%) took place during July, and the least (4.7%) in November.
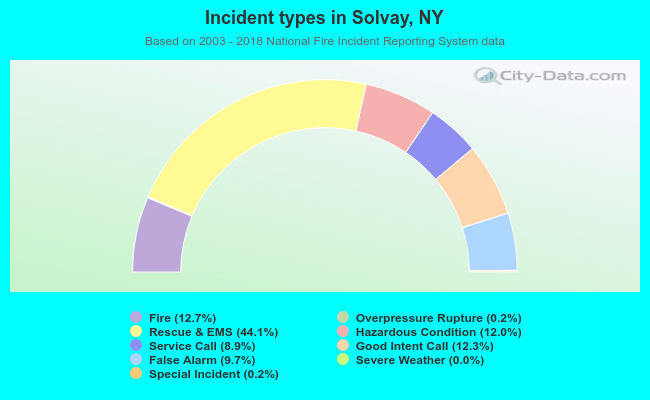 Out of all 3,687 cases reported during the years 2003 - 2018, the most belonged to the categories: Rescue & EMS (44.1%), Fire (12.7%), and Good Intent Call (12.3%).
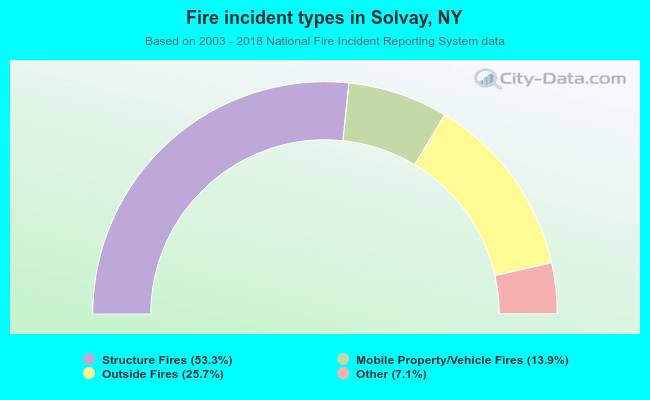 When looking into fire subcategories, the most incidents belonged to: Structure Fires (53.3%), and Outside Fires (25.7%).