Avon: Fire Incidents, Ohio (OH)
Where are fire incidents reported in Avon, OH
Something went wrong! Please refresh the page.
| Fire incidents reported | |
|---|---|
| Sreet name | Count |
| DETROIT ROAD (SR-254) | 148 |
| CHESTER RD | 108 |
| DETROIT ROADSR254 | 66 |
| CENTER ROAD (SR-83) | 64 |
| MOORE RD | 64 |
| INTERSTATE-90 (I-90/SR-2) | 62 |
| MILLER RD | 60 |
| INTERSTATE90I90SR2 | 54 |
| CENTERSR83 RD | 52 |
| JAYCOX RD | 52 |
| NAGEL RD | 36 |
| DETROIT RD | 30 |
| COLORADO {611} AVE | 28 |
| LONG RD | 26 |
| MILLS RD | 26 |
| ROSEWOOD BLVD | 26 |
| CENTER RD | 24 |
| FRENCH CREEK RD | 22 |
| SCHNEIDER CT | 22 |
| SCHWARTZ RD | 22 |
| STONEY RIDGE RD | 22 |
| CASE RD | 18 |
| CENTER (SR-83) RD | 18 |
| COLORADO AVE. (SR-611) | 16 |
| CYPRESS | 16 |
| EATON DR | 16 |
| JUST IMAGINE DR | 14 |
| MULBERRY LA | 14 |
| MOON RD | 12 |
| WILLIAMS CT | 12 |
2002 - 2018 National Fire Incident Reporting System (NFIRS) incidents
- Incident types reported to NFIRS in Avon, OH
- 8,75763.1%Rescue & EMS
- 1,59911.5%Hazardous Condition
- 1,2268.8%False Alarm
- 1,0447.5%Fire
- 7815.6%Service Call
- 4323.1%Good Intent Call
- 210.2%Severe Weather
- 190.1%Special Incident
- Fire incident types reported to NFIRS in Avon, OH
- 47945.9%Structure Fires
- 37535.9%Outside Fires
- 17917.1%Mobile Property/Vehicle Fires
- 111.1%Other
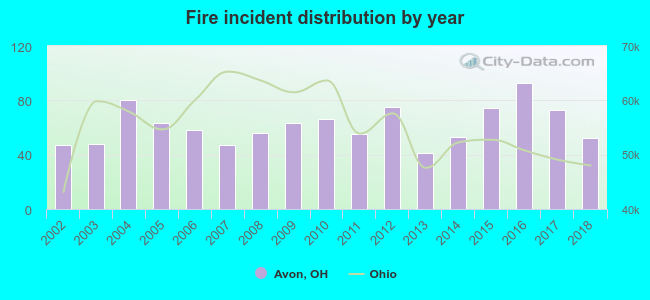 Based on the data from the years 2002 - 2018 the average number of fire incidents per year is 61. The highest number of reported fire incidents - 93 took place in 2016, and the least - 41 in 2013. The data has a rising trend.
The average number of yearly fire incidents per 10k residents in Avon, OH compared to nearest cities:
(Note: Based on data for the last 3 years, including only cities with population 5,000 and above)
| Avon: | 32.6 |
| Avon Lake: | 24.6 |
| North Ridgeville: | 19.5 |
| Westlake: | 30.5 |
| Sheffield Lake: | 48.2 |
| Bay Village: | 21.8 |
| North Olmsted: | 39.7 |
| Elyria: | 32.0 |
| Lorain: | 54.4 |
 The median response time based on all reported fire incidents is 7 minutes. This is close to the Ohio median value.
The median response time in Avon, OH compared to nearest cities:
(Note: Based on data for all years, including only cities with at least 500 fire incidents)
| Avon: | 7 minutes |
| Avon Lake: | 6 minutes |
| North Ridgeville: | 6 minutes |
| Westlake: | 6 minutes |
| Sheffield Lake: | 6 minutes |
| Bay Village: | 5 minutes |
| North Olmsted: | 4 minutes |
| Elyria: | 5 minutes |
| Lorain: | 5 minutes |
 Based on the data from the years 2002 - 2018 the average number of fire-related casualties per year is 1. The highest number of reported injuries - 5 took place in 2006, and the lowest - 0 in 2004. The data has a constant trend.
The average number of injuries per 1,000 fire incidents is 17. This indicator was the highest - 86 in 2006, and the lowest 0 in 2004. The trend for injuries per 1,000 fires is dropping. Compared to the Ohio value the number of injuries per 1,000 incidents is about the same.
Based on the data from the years 2002 - 2018 the average number of fire-related casualties per year is 1. The highest number of reported injuries - 5 took place in 2006, and the lowest - 0 in 2004. The data has a constant trend.
The average number of injuries per 1,000 fire incidents is 17. This indicator was the highest - 86 in 2006, and the lowest 0 in 2004. The trend for injuries per 1,000 fires is dropping. Compared to the Ohio value the number of injuries per 1,000 incidents is about the same.Casualties per 1,000 incidents in Avon, OH compared to nearest cities:
(Note: Based on data for all years, including only cities with at least 500 fire incidents)
| Avon: | 16.3 |
| Avon Lake: | 13.2 |
| North Ridgeville: | 11.0 |
| Westlake: | 27.5 |
| Sheffield Lake: | 22.5 |
| Bay Village: | 9.0 |
| North Olmsted: | 10.2 |
| Elyria: | 34.0 |
| Lorain: | 20.8 |
 33.1% incidents where reported in the morning and 66.9% in the evening. The most fires (15.4%) took place on Friday, and the least (13.5%) on Thursday.
 Based on the 1,044 fire incidents from years 2002 - 2018 most fires (12.1%) took place during July, and the least (5.1%) in October.
 Out of all 13,886 cases reported during the years 2002 - 2018, the most belonged to the categories: Rescue & EMS (63.1%), Hazardous Condition (11.5%), and False Alarm (8.8%).
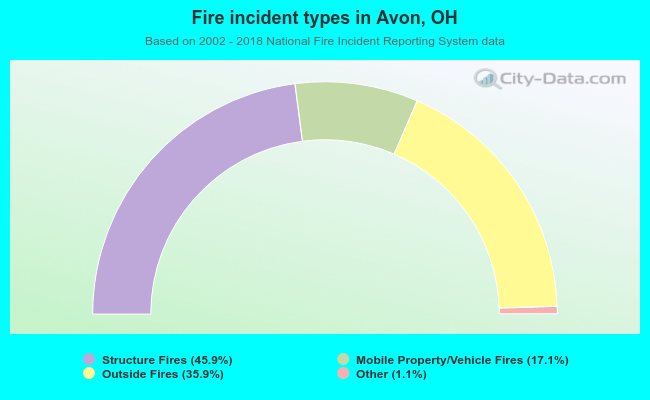 When looking into fire subcategories, the most incidents belonged to: Structure Fires (45.9%), and Outside Fires (35.9%).