Lorain: Fire Incidents, Ohio (OH)
Where are fire incidents reported in Lorain, OH
Something went wrong! Please refresh the page.
| Fire incidents reported | |
|---|---|
| Sreet name | Count |
| ERIE AVE | 436 |
| 28TH ST | 286 |
| 29TH ST | 244 |
| 30TH ST | 234 |
| OBERLIN AVE | 222 |
| 7TH ST | 172 |
| NORTH RIDGE RD | 158 |
| WASHINGTON AVE | 158 |
| 07TH ST | 154 |
| BROADWAY AVE | 154 |
| 22ND ST | 140 |
| 21ST ST | 138 |
| ELYRIA AVE | 132 |
| 32ND ST | 130 |
| 31ST ST | 124 |
| 33RD ST | 118 |
| 17TH ST | 106 |
| 23RD ST | 102 |
| 34TH ST | 102 |
| 37TH ST | 102 |
| BROADWAY | 102 |
| PEARL AVE | 100 |
| 14TH ST | 98 |
| LEAVITT RD | 96 |
| TOWER BLVD | 96 |
| 36TH ST | 94 |
| REID AVE | 94 |
| COLORADO AVE | 92 |
| 09TH ST | 86 |
| 20TH ST | 86 |
| Other | 784 |
2002 - 2018 National Fire Incident Reporting System (NFIRS) incidents
- Incident types reported to NFIRS in Lorain, OH
- 5,41434.0%Hazardous Condition
- 5,14032.2%Fire
- 1,69410.6%Service Call
- 1,5209.5%False Alarm
- 1,3068.2%Rescue & EMS
- 6864.3%Good Intent Call
- 820.5%Overpressure Rupture
- 680.4%Severe Weather
- 280.2%Special Incident
- Fire incident types reported to NFIRS in Lorain, OH
- 2,26544.1%Outside Fires
- 2,20642.9%Structure Fires
- 65312.7%Mobile Property/Vehicle Fires
- 160.3%Other
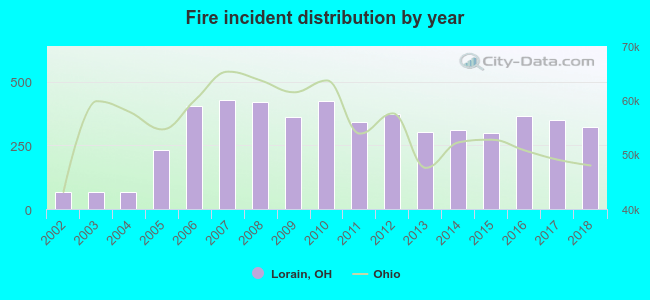 Based on the data from the years 2002 - 2018 the average number of fires per year is 302. The highest number of reported fires - 427 took place in 2007, and the least - 67 in 2003. The data has an increasing trend.
The average number of yearly fire incidents per 10k residents in Lorain, OH compared to nearest cities:
(Note: Based on data for the last 3 years, including only cities with population 5,000 and above)
| Lorain: | 54.4 |
| Amherst: | 59.8 |
| Sheffield Lake: | 48.2 |
| Elyria: | 32.0 |
| Avon: | 32.6 |
| Avon Lake: | 24.6 |
| Vermilion: | 48.4 |
| North Ridgeville: | 19.5 |
| Oberlin: | 58.6 |
 The median response time based on all reported fire incidents is 5 minutes. This is lower compared to the state median value.
The median response time in Lorain, OH compared to nearest cities:
(Note: Based on data for all years, including only cities with at least 500 fire incidents)
| Lorain: | 5 minutes |
| Amherst: | 9 minutes |
| Sheffield Lake: | 6 minutes |
| Elyria: | 5 minutes |
| Avon: | 7 minutes |
| Avon Lake: | 6 minutes |
| Vermilion: | 8 minutes |
| North Ridgeville: | 6 minutes |
| Oberlin: | 6 minutes |
 According to the reports from the years 2002 - 2018 the average number of fire-related yearly deaths is 1. The highest number of deaths - 4 took place in 2016, and the lowest - 0 in 2002. The data has a rising trend.
The average number of deaths per 1,000 fires is 3. This indicator was the highest - 11 in 2016, and the lowest 0 in 2002. The trend for fatalities per 1,000 fire incidents is growing. Compared to the Ohio value the number of deaths per 1,000 fire incidents is higher.
According to the reports from the years 2002 - 2018 the average number of fire-related yearly deaths is 1. The highest number of deaths - 4 took place in 2016, and the lowest - 0 in 2002. The data has a rising trend.
The average number of deaths per 1,000 fires is 3. This indicator was the highest - 11 in 2016, and the lowest 0 in 2002. The trend for fatalities per 1,000 fire incidents is growing. Compared to the Ohio value the number of deaths per 1,000 fire incidents is higher.
 Based on the reports from the years 2002 - 2018 the average number of fire-related casualties per year is 6. The highest number of reported casualties - 14 took place in 2007, and the lowest - 0 in 2003. The data has a rising trend.
The average number of injuries per 1,000 fires is 19. This indicator was the highest - 33 in 2007, and the lowest 0 in 2003. The trend for casualties per 1,000 fires is dropping. Compared to the state value the number of casualties per 1,000 incidents is higher.
Based on the reports from the years 2002 - 2018 the average number of fire-related casualties per year is 6. The highest number of reported casualties - 14 took place in 2007, and the lowest - 0 in 2003. The data has a rising trend.
The average number of injuries per 1,000 fires is 19. This indicator was the highest - 33 in 2007, and the lowest 0 in 2003. The trend for casualties per 1,000 fires is dropping. Compared to the state value the number of casualties per 1,000 incidents is higher.Casualties per 1,000 incidents in Lorain, OH compared to nearest cities:
(Note: Based on data for all years, including only cities with at least 500 fire incidents)
| Lorain: | 20.8 |
| Amherst: | 8.3 |
| Sheffield Lake: | 22.5 |
| Elyria: | 34.0 |
| Avon: | 16.3 |
| Avon Lake: | 13.2 |
| Vermilion: | 14.8 |
| North Ridgeville: | 11.0 |
| Oberlin: | 18.5 |
 28.5% incidents where reported in the morning and 71.5% in the evening. The most fires (15.6%) took place on Saturday, and the least (12.9%) on Wednesday.
 Based on the 5,140 fire incidents from years 2002 - 2018 most fires (11.8%) took place during July, and the least (5.2%) in February.
 Out of all 15,938 cases reported during the years 2002 - 2018, the most belonged to the categories: Hazardous Condition (34.0%), Fire (32.2%), and Service Call (10.6%).
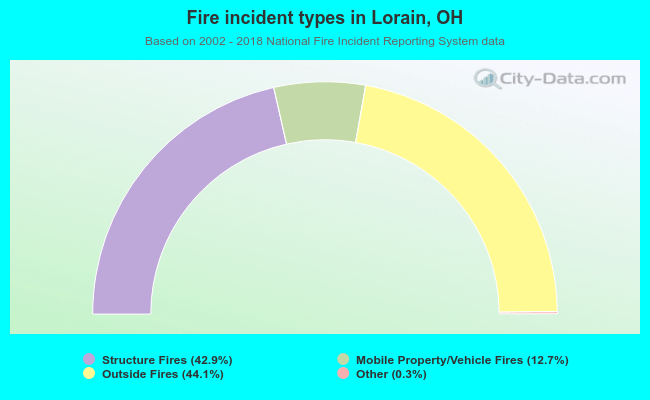 When looking into fire subcategories, the most reports belonged to: Outside Fires (44.1%), and Structure Fires (42.9%).