Baldwin: Fire Incidents, Michigan (MI)
Where are fire incidents reported in Baldwin, MI
Something went wrong! Please refresh the page.
|
| |||||||||||||||||||||||||||||||||||||||||||||||||||||||||||||||||||||||||||||||||||||||||||||||||||||||||||||
| Other | 184 | |||||||||||||||||||||||||||||||||||||||||||||||||||||||||||||||||||||||||||||||||||||||||||||||||||||||||||||
2002 - 2018 National Fire Incident Reporting System (NFIRS) incidents
- Incident types reported to NFIRS in Baldwin, MI
- 78637.7%Fire
- 66932.1%Hazardous Condition
- 21810.4%Rescue & EMS
- 1778.5%Service Call
- 1698.1%Good Intent Call
- 482.3%False Alarm
- 80.4%Overpressure Rupture
- 70.3%Special Incident
- 50.2%Severe Weather
- Fire incident types reported to NFIRS in Baldwin, MI
- 39850.6%Structure Fires
- 27034.4%Outside Fires
- 8210.4%Mobile Property/Vehicle Fires
- 364.6%Other
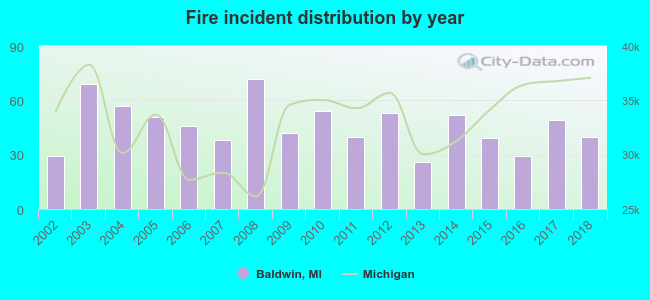 Based on the data from the years 2002 - 2018 the average number of fire incidents per year is 46. The highest number of reported fire incidents - 72 took place in 2008, and the least - 26 in 2013. The data has a rising trend.
 The median response time based on all reported fire incidents is 9 minutes. This is higher compared to the state median value.
The median response time in Baldwin, MI compared to nearest cities:
(Note: Based on data for all years, including only cities with at least 500 fire incidents)
| Baldwin: | 9 minutes |
| Reed City: | 12 minutes |
| Big Rapids: | 8 minutes |
| White Cloud: | 11 minutes |
| Ludington: | 8 minutes |
| Fremont: | 9 minutes |
| Cadillac: | 7 minutes |
| Newaygo: | 9 minutes |
| Manistee: | 5 minutes |
 28.0% incidents where reported in the morning and 72.0% in the evening. The most fires (17.4%) took place on Saturday, and the least (11.2%) on Wednesday.
 According to the 786 fires from years 2002 - 2018 most fires (21.5%) took place during April, and the least (4.1%) in December.
 Out of all 2,087 cases reported during the years 2002 - 2018, the most belonged to the categories: Fire (37.7%), Hazardous Condition (32.1%), and Rescue & EMS (10.4%).
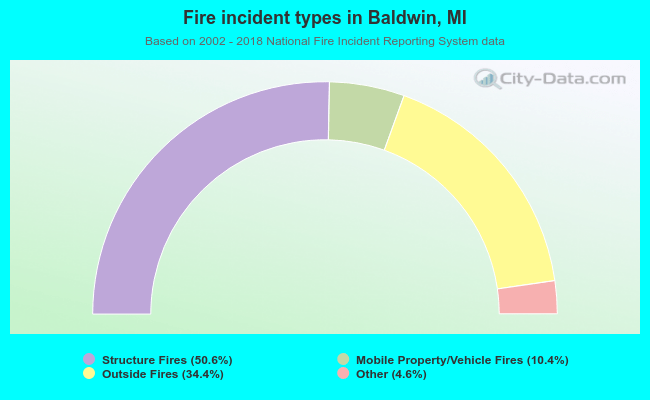 When looking into fire subcategories, the most incidents belonged to: Structure Fires (50.6%), and Outside Fires (34.4%).