Cadillac: Fire Incidents, Michigan (MI)
Where are fire incidents reported in Cadillac, MI
Something went wrong! Please refresh the page.
| Fire incidents reported | |
|---|---|
| Sreet name | Count |
| MITCHELL ST | 110 |
| 34 RD | 84 |
| M-115 HWY | 44 |
| SEELEY RD | 40 |
| SUNNYSIDE DR | 28 |
| 13TH ST | 26 |
| LAKE ST | 26 |
| 29 RD | 24 |
| 6TH ST | 24 |
| M115 HWY | 24 |
| DIVISION ST | 22 |
| HAYNES ST | 22 |
| M-55 HWY | 22 |
| WRIGHT ST | 22 |
| 30 RD | 20 |
| 32 RD | 20 |
| 41 RD | 20 |
| CHAPIN ST | 20 |
| LEESON AVE | 20 |
| CADILLAC SHORES DR | 18 |
| NORTH ST | 18 |
| 47 RD | 16 |
| 48 RD | 16 |
| 50 RD | 16 |
| COTEY ST | 16 |
| NELSON ST | 16 |
| PEARL ST | 16 |
| U.S. 131 HWY | 16 |
| 39 RD | 14 |
| 4TH AVE | 14 |
| Other | 679 |
2002 - 2018 National Fire Incident Reporting System (NFIRS) incidents
- Incident types reported to NFIRS in Cadillac, MI
- 10,15067.9%Rescue & EMS
- 1,4739.9%Fire
- 1,4359.6%Hazardous Condition
- 8565.7%Service Call
- 6694.5%Good Intent Call
- 3202.1%False Alarm
- 160.1%Overpressure Rupture
- Fire incident types reported to NFIRS in Cadillac, MI
- 82856.2%Structure Fires
- 35524.1%Outside Fires
- 23816.2%Mobile Property/Vehicle Fires
- 523.5%Other
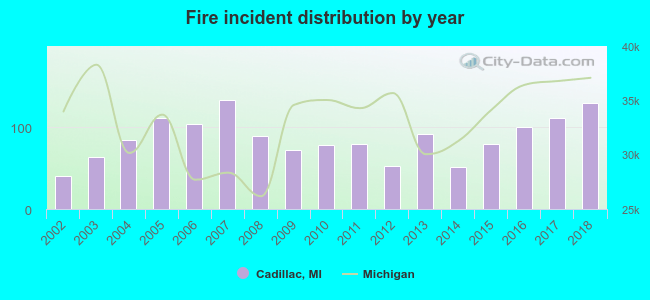 According to the data from the years 2002 - 2018 the average number of fires per year is 87. The highest number of reported fire incidents - 133 took place in 2007, and the least - 41 in 2002. The data has a growing trend.
The average number of yearly fire incidents per 10k residents in Cadillac, MI compared to nearest cities:
(Note: Based on data for the last 3 years, including only cities with population 5,000 and above)
| Cadillac: | 110.0 |
| Traverse City: | 108.6 |
| Big Rapids: | 63.8 |
| Manistee: | 54.7 |
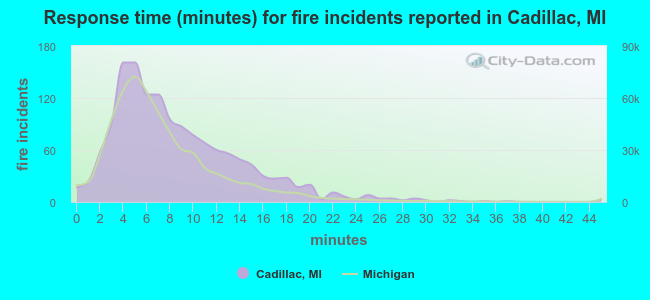 The median response time based on all reported fire incidents is 7 minutes. This is similar to the state median value.
The median response time in Cadillac, MI compared to nearest cities:
(Note: Based on data for all years, including only cities with at least 500 fire incidents)
| Cadillac: | 7 minutes |
| Lake City: | 11 minutes |
| Fife Lake: | 11 minutes |
| Reed City: | 12 minutes |
| Baldwin: | 9 minutes |
| Houghton Lake: | 8 minutes |
| Harrison: | 14 minutes |
| Traverse City: | 7 minutes |
| Big Rapids: | 8 minutes |
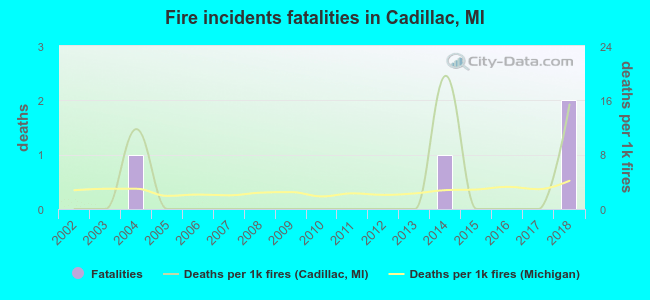 According to the data from the years 2002 - 2018 the average number of fire-related fatalities per year is 0. The highest number of reported deaths - 2 took place in 2018, and the lowest - 0 in 2002. The data has a growing trend.
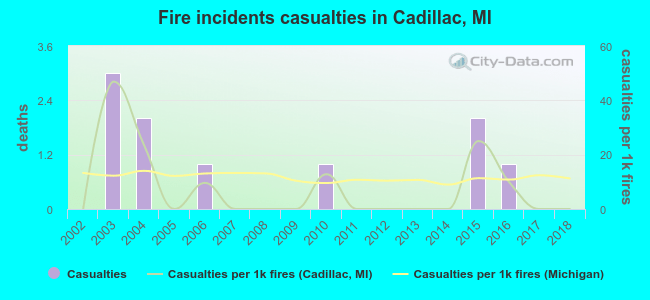 Based on the data from the years 2002 - 2018 the average number of fire-related yearly casualties is 1. The highest number of injuries - 3 took place in 2003, and the lowest - 0 in 2002. The data has a constant trend.
The average number of injuries per 1,000 fire incidents is 8. This indicator was the highest - 47 in 2003, and the lowest 0 in 2002. The trend for injuries per 1,000 incidents is constant. Compared to the state value the number of casualties per 1,000 incidents is lower.
Based on the data from the years 2002 - 2018 the average number of fire-related yearly casualties is 1. The highest number of injuries - 3 took place in 2003, and the lowest - 0 in 2002. The data has a constant trend.
The average number of injuries per 1,000 fire incidents is 8. This indicator was the highest - 47 in 2003, and the lowest 0 in 2002. The trend for injuries per 1,000 incidents is constant. Compared to the state value the number of casualties per 1,000 incidents is lower.Casualties per 1,000 incidents in Cadillac, MI compared to nearest cities:
(Note: Based on data for all years, including only cities with at least 500 fire incidents)
| Cadillac: | 6.8 |
| Lake City: | 4.7 |
| Fife Lake: | 0.0 |
| Reed City: | 1.8 |
| Baldwin: | 1.3 |
| Houghton Lake: | 6.2 |
| Harrison: | 3.8 |
| Traverse City: | 13.2 |
| Big Rapids: | 5.7 |
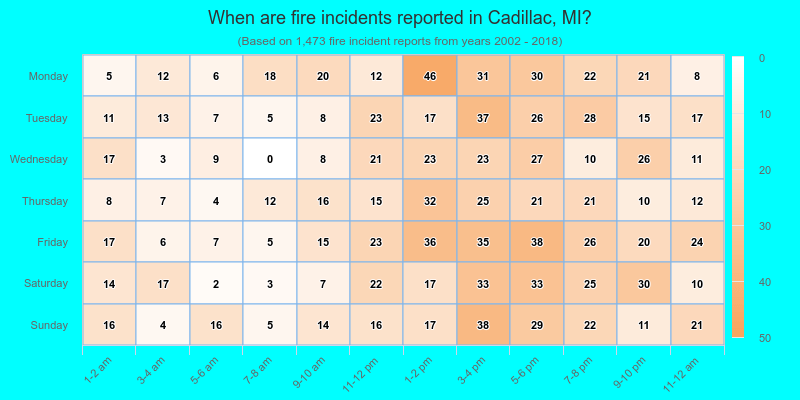
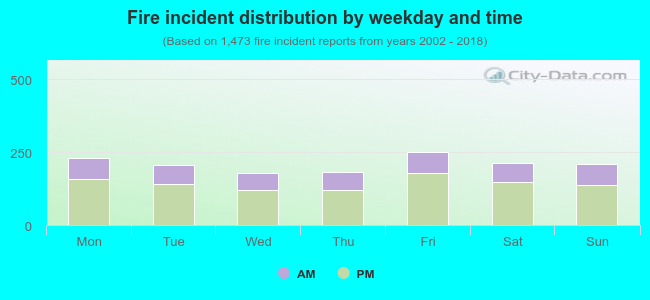 31.8% incidents where reported in the morning and 68.2% in the evening. The most fires (17.1%) took place on Friday, and the least (12.1%) on Wednesday.
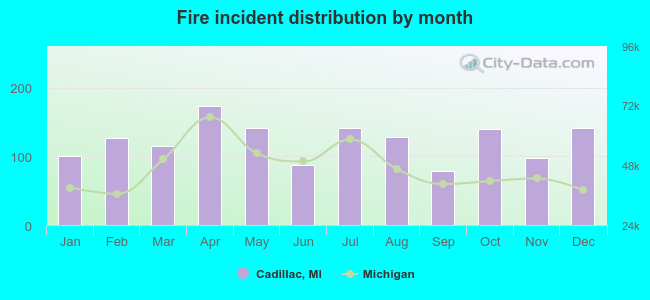 Based on the 1,473 fire incident reports from years 2002 - 2018 most fires (11.8%) took place during April, and the least (5.4%) in September.
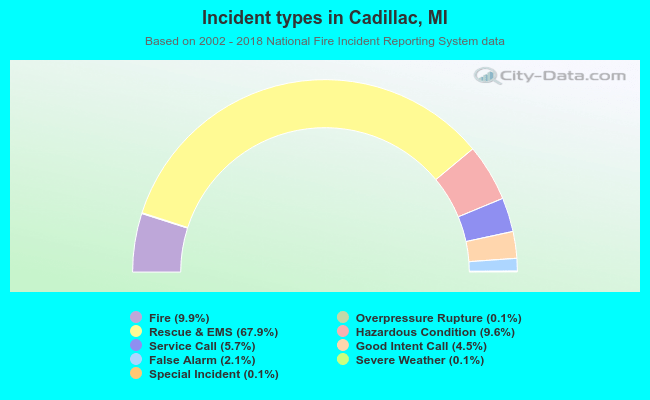 Out of all 14,938 cases reported during the years 2002 - 2018, the most belonged to the categories: Rescue & EMS (67.9%), Fire (9.9%), and Hazardous Condition (9.6%).
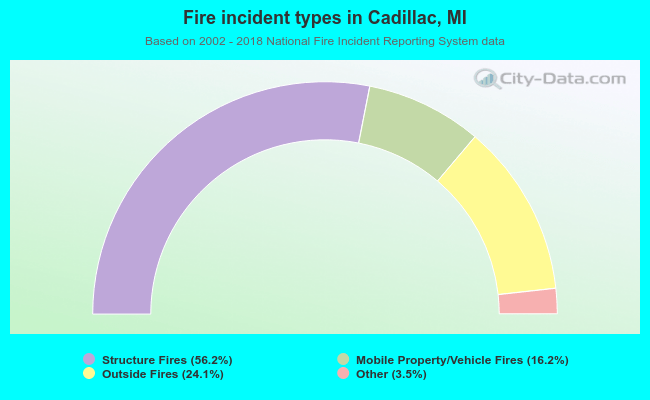 When looking into fire subcategories, the most reports belonged to: Structure Fires (56.2%), and Outside Fires (24.1%).