Batavia: Fire Incidents, New York (NY)
Where are fire incidents reported in Batavia, NY
Something went wrong! Please refresh the page.
| Fire incidents reported | |
|---|---|
| Sreet name | Count |
| MAIN ST | 460 |
| BATAVIA -STAFFORD TOWNLN RD | 318 |
| BANK ST | 88 |
| ELLICOTT ST | 80 |
| NEW YORK STATE THRUWAY | 74 |
| LEWISTON RD | 62 |
| STATE ST | 54 |
| W MAIN STREET RD | 52 |
| BATAVIA STAFFORD TOWNLINE RD | 50 |
| E MAIN ST | 42 |
| PARK RD | 42 |
| LIBERTY ST | 38 |
| WASHINGTON AVE | 34 |
| NYS THRUWAY | 32 |
| MAIN STREET RD | 30 |
| PEARL STREET RD | 30 |
| RICHMOND AVE | 30 |
| WEST MAIN RD | 30 |
| JACKSON ST | 28 |
| VINE ST | 28 |
| OAK ST | 26 |
| STATE STREET RD | 24 |
| VETERANS MEMORIAL DR | 24 |
| VETERANS MEMORIAL DR | 24 |
| BANK ST | 22 |
| CLINTON STREET RD | 22 |
| ELLICOTT ST | 22 |
| PEARL ST | 22 |
| ROSE RD | 20 |
| BANK STREET RD | 18 |
2002 - 2018 National Fire Incident Reporting System (NFIRS) incidents
- Incident types reported to NFIRS in Batavia, NY
- 10,28254.7%Rescue & EMS
- 2,83015.1%Hazardous Condition
- 2,09411.1%False Alarm
- 1,6648.9%Fire
- 1,0375.5%Service Call
- 7373.9%Good Intent Call
- 610.3%Overpressure Rupture
- 500.3%Special Incident
- 350.2%Severe Weather
- Fire incident types reported to NFIRS in Batavia, NY
- 96958.2%Structure Fires
- 37322.4%Outside Fires
- 23113.9%Mobile Property/Vehicle Fires
- 915.5%Other
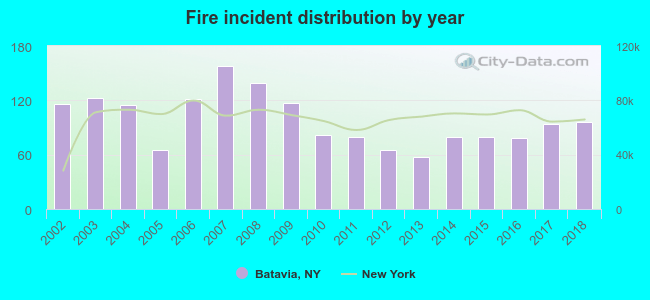 According to the data from the years 2002 - 2018 the average number of fires per year is 98. The highest number of reported fire incidents - 158 took place in 2007, and the least - 57 in 2013. The data has a dropping trend.
The average number of yearly fire incidents per 10k residents in Batavia, NY compared to nearest cities:
(Note: Based on data for the last 3 years, including only cities with population 5,000 and above)
| Batavia: | 59.3 |
| Riga: | 4.8 |
| Newstead: | 4.3 |
| Albion: | 91.0 |
| Medina: | 106.9 |
| Sweden: | 15.0 |
| Brockport: | 29.8 |
| Ridgeway: | 2.9 |
| Clarkson: | 31.2 |
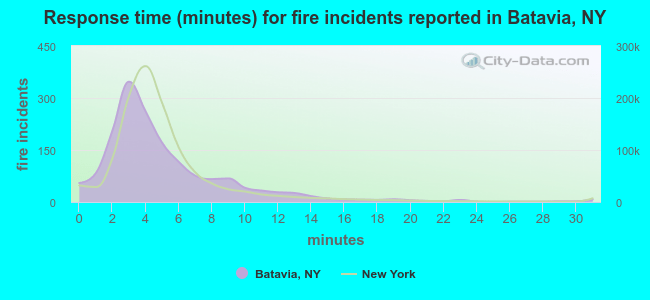 The median response time based on all reported fire incidents is 4 minutes. This is close to the New York median value.
The median response time in Batavia, NY compared to nearest cities:
(Note: Based on data for all years, including only cities with at least 500 fire incidents)
| Batavia: | 4 minutes |
| Akron: | 6 minutes |
| Albion: | 7 minutes |
| Medina: | 5 minutes |
| Brockport: | 5 minutes |
| Avon: | 6 minutes |
| Spencerport: | 8 minutes |
| Geneseo: | 5 minutes |
| Lancaster: | 0 minutes |
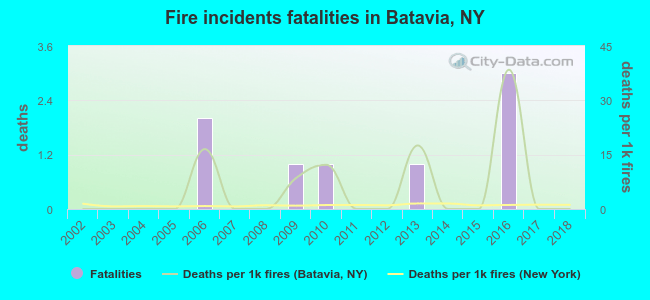 Based on the reports from the years 2002 - 2018 the average number of fire-related fatalities per year is 0. The highest number of reported deaths - 3 took place in 2016, and the lowest - 0 in 2002. The data has a constant trend.
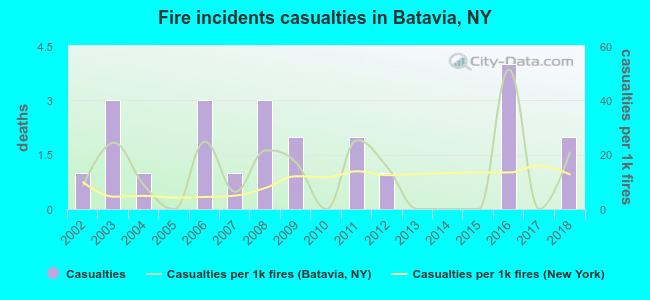 Based on the data from the years 2002 - 2018 the average number of fire-related yearly casualties is 1. The highest number of reported casualties - 4 took place in 2016, and the lowest - 0 in 2005. The data has a rising trend.
The average number of injuries per 1,000 fires is 13. This indicator was the highest - 51 in 2016, and the lowest 0 in 2005. The trend for injuries per 1,000 fire incidents is increasing. Compared to the New York value the number of injuries per 1,000 fire incidents is higher.
Based on the data from the years 2002 - 2018 the average number of fire-related yearly casualties is 1. The highest number of reported casualties - 4 took place in 2016, and the lowest - 0 in 2005. The data has a rising trend.
The average number of injuries per 1,000 fires is 13. This indicator was the highest - 51 in 2016, and the lowest 0 in 2005. The trend for injuries per 1,000 fire incidents is increasing. Compared to the New York value the number of injuries per 1,000 fire incidents is higher.
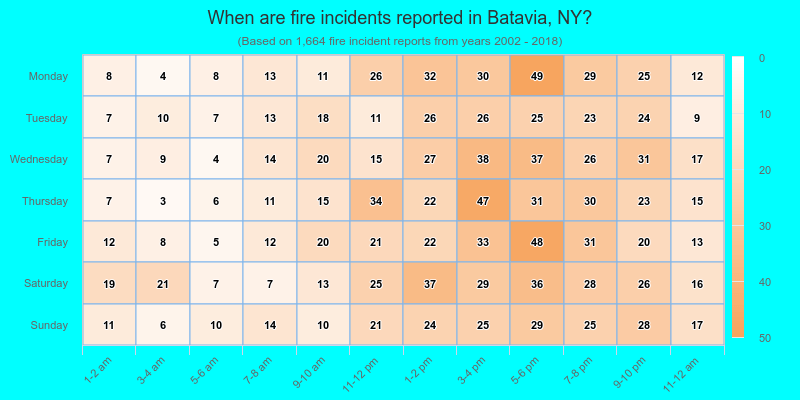
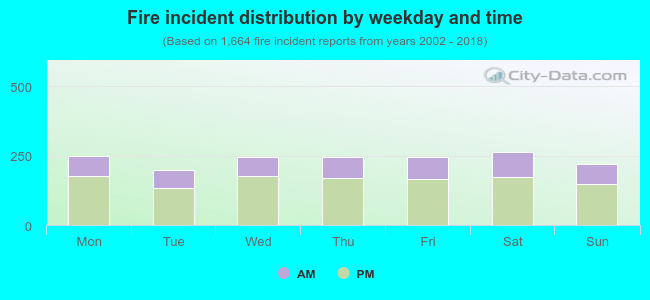 31.4% incidents where reported in the morning and 68.6% in the evening. The most fires (15.9%) took place on Saturday, and the least (12.0%) on Tuesday.
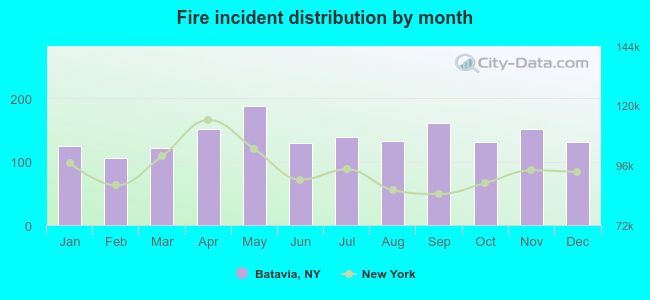 Based on the 1,664 fire incident reports from years 2002 - 2018 most fires (11.3%) took place during May, and the least (6.4%) in February.
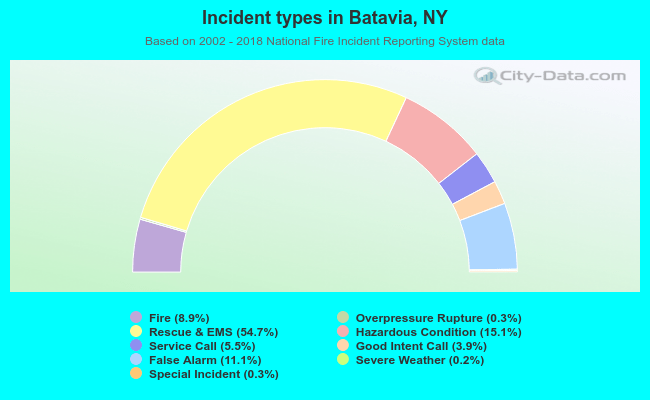 Out of all 18,790 cases reported during the years 2002 - 2018, the most belonged to the categories: Rescue & EMS (54.7%), Hazardous Condition (15.1%), and False Alarm (11.1%).
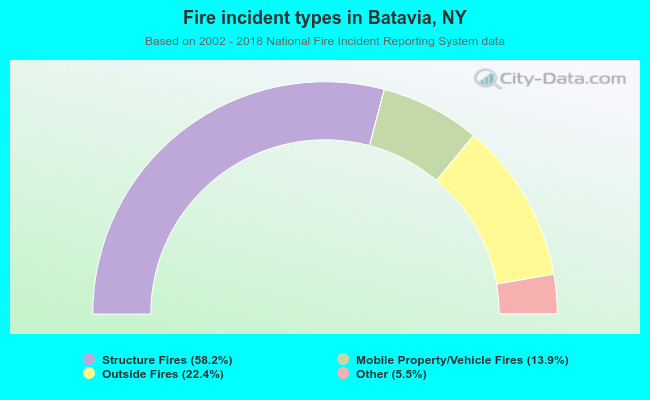 When looking into fire subcategories, the most reports belonged to: Structure Fires (58.2%), and Outside Fires (22.4%).