Baxter Springs: Fire Incidents, Kansas (KS)
Where are fire incidents reported in Baxter Springs, KS
Something went wrong! Please refresh the page.
|
| |||||||||||||||||||||||||||||||||||||||||||||||||||||||||||||||||||||||||||||||||||||||||||||||||||||||||||||
| Other | 127 | |||||||||||||||||||||||||||||||||||||||||||||||||||||||||||||||||||||||||||||||||||||||||||||||||||||||||||||
2002 - 2018 National Fire Incident Reporting System (NFIRS) incidents
- Incident types reported to NFIRS in Baxter Springs, KS
- 1,48955.1%Fire
- 35513.1%Rescue & EMS
- 33612.4%Hazardous Condition
- 29711.0%Good Intent Call
- 963.6%Service Call
- 913.4%False Alarm
- 331.2%Severe Weather
- 60.2%Overpressure Rupture
- Fire incident types reported to NFIRS in Baxter Springs, KS
- 97565.5%Outside Fires
- 35523.8%Structure Fires
- 1308.7%Mobile Property/Vehicle Fires
- 291.9%Other
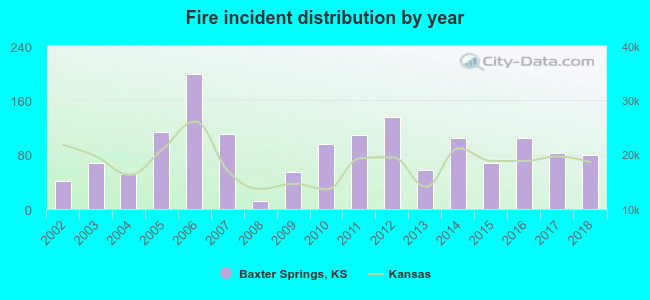 According to the data from the years 2002 - 2018 the average number of fire incidents per year is 88. The highest number of reported fire incidents - 199 took place in 2006, and the least - 12 in 2008. The data has an increasing trend.
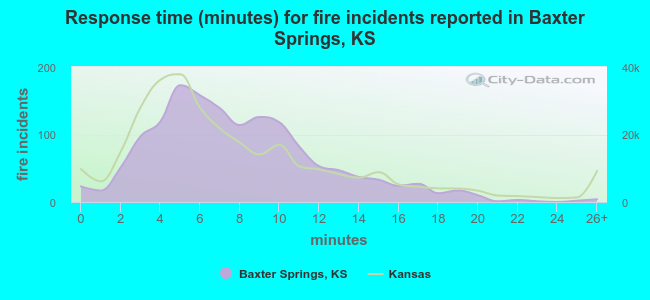 The median response time based on all reported fire incidents is 7 minutes. This is close to the state median value.
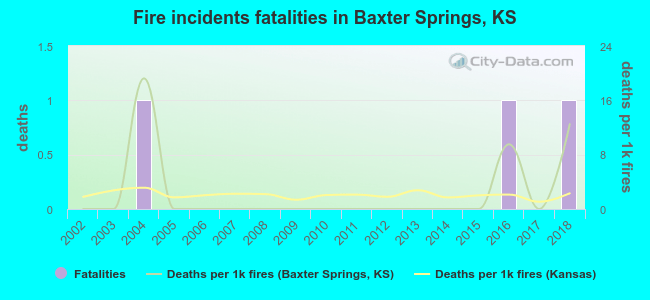 Based on the data from the years 2002 - 2018 the average number of fire-related yearly deaths is 0. The highest number of reported deaths - 1 took place in 2004, and the lowest - 0 in 2002. The data has a rising trend.
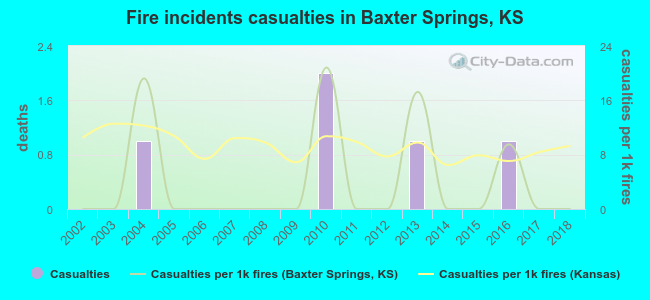 According to the reports from the years 2002 - 2018 the average number of fire-related casualties per year is 0. The highest number of casualties - 2 took place in 2010, and the lowest - 0 in 2002. The data has a constant trend.
The average number of injuries per 1,000 fires is 4. This indicator was the highest - 21 in 2010, and the lowest 0 in 2002. The trend for casualties per 1,000 fires is constant. Compared to the state value the number of casualties per 1,000 fire incidents is much lower.
According to the reports from the years 2002 - 2018 the average number of fire-related casualties per year is 0. The highest number of casualties - 2 took place in 2010, and the lowest - 0 in 2002. The data has a constant trend.
The average number of injuries per 1,000 fires is 4. This indicator was the highest - 21 in 2010, and the lowest 0 in 2002. The trend for casualties per 1,000 fires is constant. Compared to the state value the number of casualties per 1,000 fire incidents is much lower.
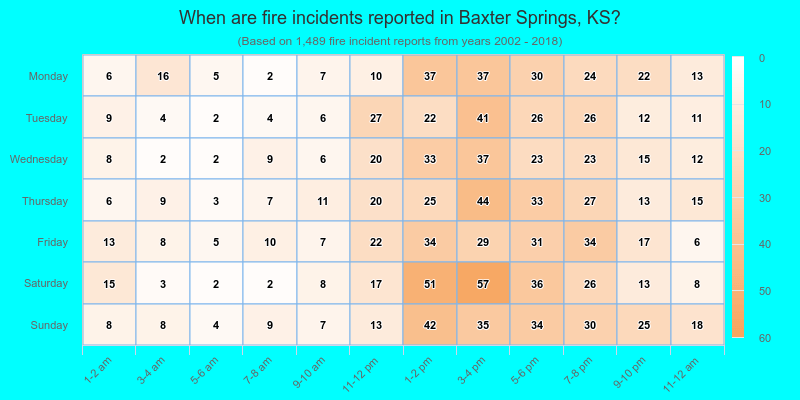
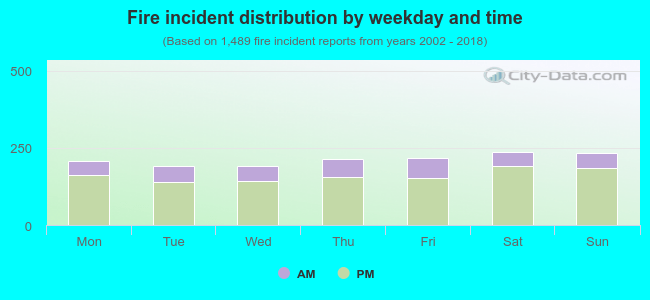 24.3% incidents where reported in the morning and 75.7% in the evening. The most fires (16.0%) took place on Saturday, and the least (12.8%) on Tuesday.
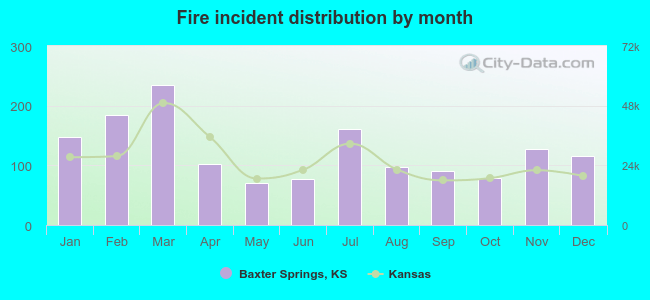 Based on the 1,489 reports from years 2002 - 2018 most fires (15.8%) took place during March, and the least (4.7%) in May.
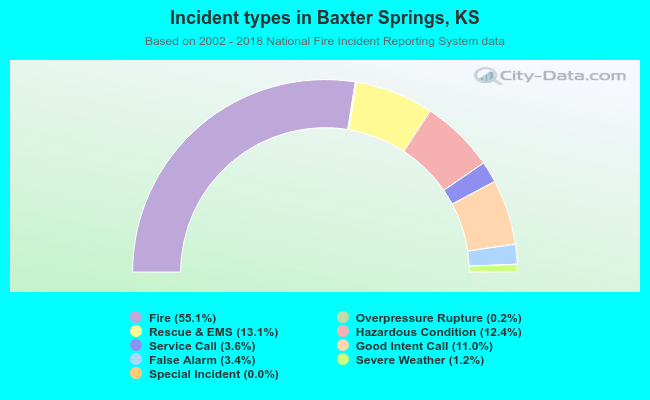 Out of all 2,704 cases reported during the years 2002 - 2018, the most belonged to the categories: Fire (55.1%), Rescue & EMS (13.1%), and Hazardous Condition (12.4%).
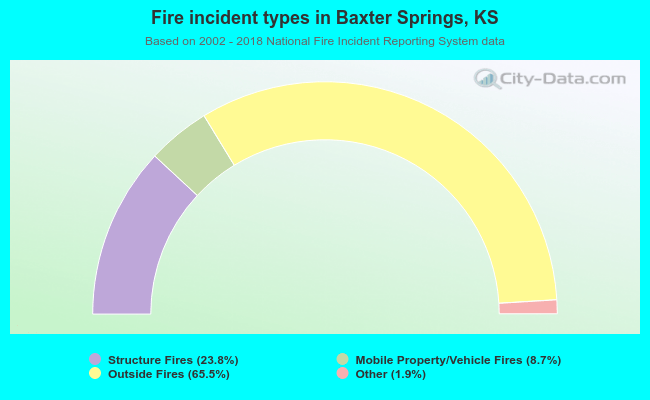 When looking into fire subcategories, the most reports belonged to: Outside Fires (65.5%), and Structure Fires (23.8%).