Pittsburg: Fire Incidents, Kansas (KS)
Where are fire incidents reported in Pittsburg, KS
Something went wrong! Please refresh the page.
| Fire incidents reported | |
|---|---|
| Sreet name | Count |
| BROADWAY | 480 |
| 4TH | 198 |
| JOPLIN | 178 |
| ROUSE | 150 |
| 250 ST | 144 |
| ELM | 128 |
| 220 ST | 124 |
| 200 ST | 120 |
| MICHIGAN | 112 |
| 9TH | 96 |
| 3RD | 94 |
| 20TH | 90 |
| 260 ST | 90 |
| CENTENNIAL | 90 |
| QUINCY | 90 |
| 8TH | 88 |
| PARK | 84 |
| WASHINGTON | 82 |
| 190 ST | 80 |
| 7TH | 80 |
| 6TH | 76 |
| 23RD | 74 |
| PINE | 74 |
| 210 ST | 72 |
| FOREST | 72 |
| LOCUST | 72 |
| FREE KING HWY | 70 |
| 240 ST | 66 |
| WALNUT | 66 |
| 4TH ST | 64 |
| Other | 138 |
2002 - 2018 National Fire Incident Reporting System (NFIRS) incidents
- Incident types reported to NFIRS in Pittsburg, KS
- 4,12628.2%Rescue & EMS
- 3,44223.5%Fire
- 2,92120.0%Service Call
- 1,77612.1%Hazardous Condition
- 1,0657.3%False Alarm
- 9946.8%Special Incident
- 2681.8%Good Intent Call
- 380.3%Severe Weather
- Fire incident types reported to NFIRS in Pittsburg, KS
- 1,94756.6%Outside Fires
- 1,05230.6%Structure Fires
- 36510.6%Mobile Property/Vehicle Fires
- 782.3%Other
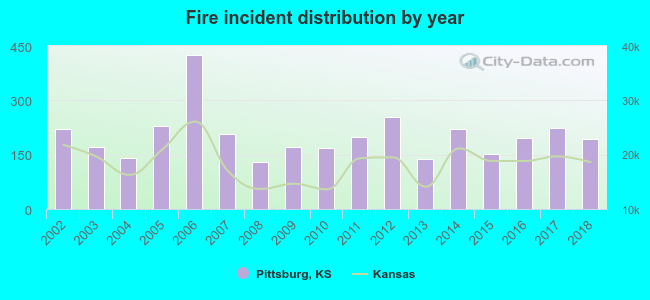 According to the data from the years 2002 - 2018 the average number of fires per year is 202. The highest number of fires - 425 took place in 2006, and the least - 130 in 2008. The data has a dropping trend.
The average number of yearly fire incidents per 10k residents in Pittsburg, KS compared to nearest cities:
(Note: Based on data for the last 3 years, including only cities with population 5,000 and above)
| Pittsburg: | 99.9 |
| Fort Scott: | 218.9 |
| Parsons: | 91.1 |
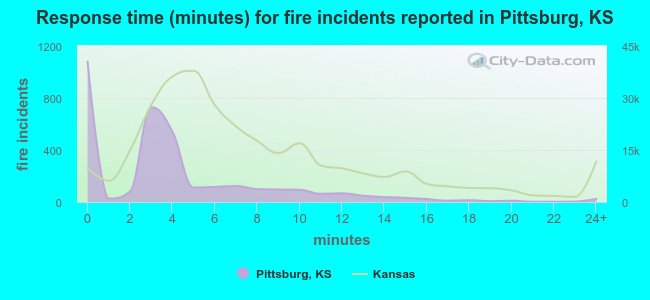 The median response time based on all reported fire incidents is 3 minutes. This is much lower than the state median value.
The median response time in Pittsburg, KS compared to nearest cities:
(Note: Based on data for all years, including only cities with at least 500 fire incidents)
| Pittsburg: | 3 minutes |
| Columbus: | 10 minutes |
| Galena: | 5 minutes |
| Baxter Springs: | 7 minutes |
| Fort Scott: | 7 minutes |
| Parsons: | 6 minutes |
| Chetopa: | 6 minutes |
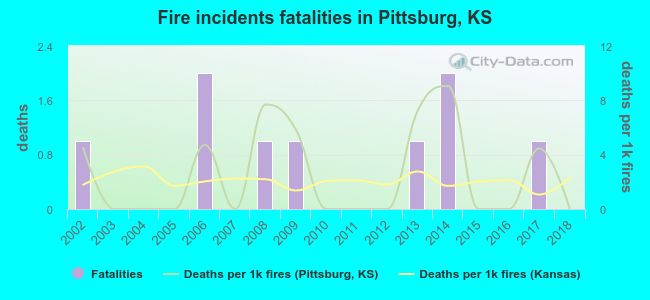 According to the reports from the years 2002 - 2018 the average number of fire-related yearly deaths is 1. The highest number of reported deaths - 2 took place in 2006, and the lowest - 0 in 2003. The data has a decreasing trend.
The average number of fatalities per 1,000 fire incidents is 3. This indicator was the highest - 9 in 2014, and the lowest 0 in 2003. The trend for fatalities per 1,000 fires is dropping. Compared to the Kansas value the number of deaths per 1,000 fires is higher.
According to the reports from the years 2002 - 2018 the average number of fire-related yearly deaths is 1. The highest number of reported deaths - 2 took place in 2006, and the lowest - 0 in 2003. The data has a decreasing trend.
The average number of fatalities per 1,000 fire incidents is 3. This indicator was the highest - 9 in 2014, and the lowest 0 in 2003. The trend for fatalities per 1,000 fires is dropping. Compared to the Kansas value the number of deaths per 1,000 fires is higher.Deaths per 1,000 incidents in Pittsburg, KS compared to nearest cities:
(Note: Based on data for all years, including only cities with at least 2,500 fire incidents)
| Pittsburg: | 2.6 |
| Fort Scott: | 1.9 |
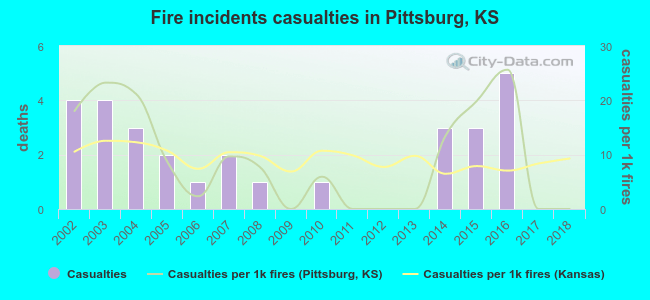 Based on the reports from the years 2002 - 2018 the average number of fire-related casualties per year is 2. The highest number of casualties - 5 took place in 2016, and the lowest - 0 in 2009. The data has a declining trend.
The average number of casualties per 1,000 fire incidents is 9. This indicator was the highest - 26 in 2016, and the lowest 0 in 2009. The trend for injuries per 1,000 fire incidents is dropping. Compared to the state value the number of injuries per 1,000 incidents is about the same.
Based on the reports from the years 2002 - 2018 the average number of fire-related casualties per year is 2. The highest number of casualties - 5 took place in 2016, and the lowest - 0 in 2009. The data has a declining trend.
The average number of casualties per 1,000 fire incidents is 9. This indicator was the highest - 26 in 2016, and the lowest 0 in 2009. The trend for injuries per 1,000 fire incidents is dropping. Compared to the state value the number of injuries per 1,000 incidents is about the same.Casualties per 1,000 incidents in Pittsburg, KS compared to nearest cities:
(Note: Based on data for all years, including only cities with at least 500 fire incidents)
| Pittsburg: | 8.4 |
| Columbus: | 0.5 |
| Galena: | 0.0 |
| Baxter Springs: | 3.4 |
| Fort Scott: | 3.7 |
| Parsons: | 9.1 |
| Chetopa: | 0.0 |
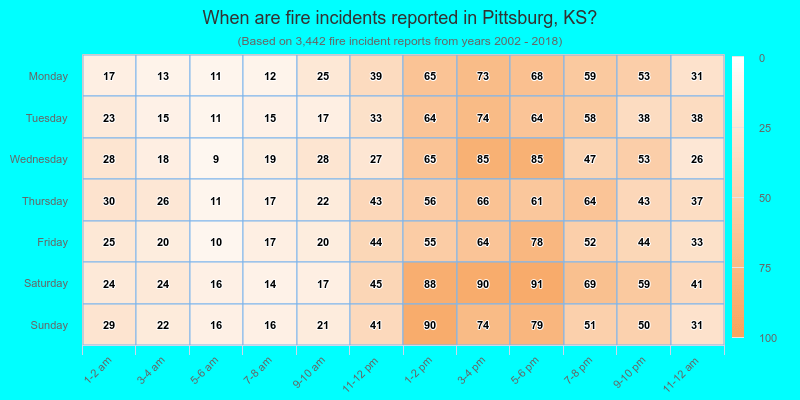
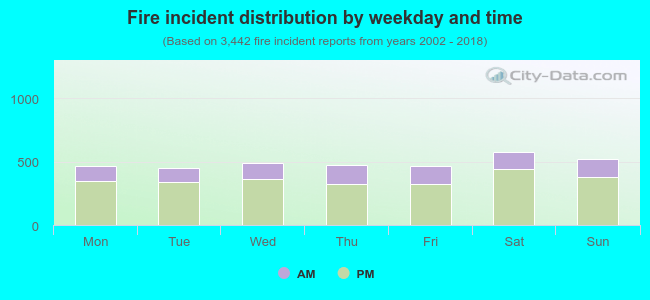 27.0% incidents where reported in the morning and 73.0% in the evening. The most fires (16.8%) took place on Saturday, and the least (13.1%) on Tuesday.
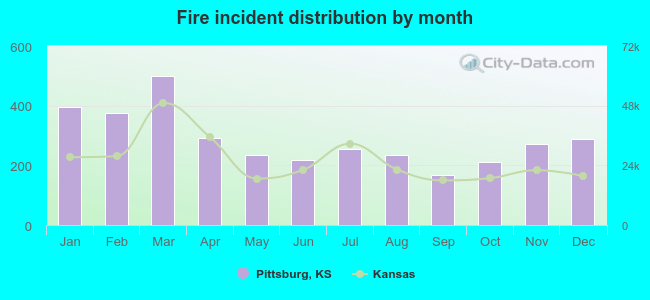 Based on the 3,442 incident reports from years 2002 - 2018 most fires (14.5%) took place during March, and the least (4.9%) in September.
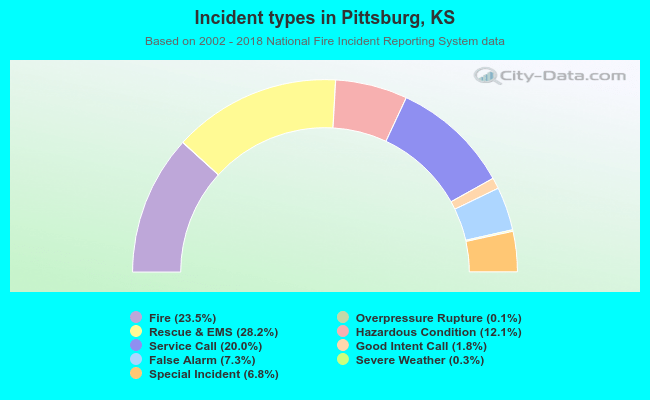 Out of all 14,640 cases reported during the years 2002 - 2018, the most belonged to the categories: Rescue & EMS (28.2%), Fire (23.5%), and Service Call (20.0%).
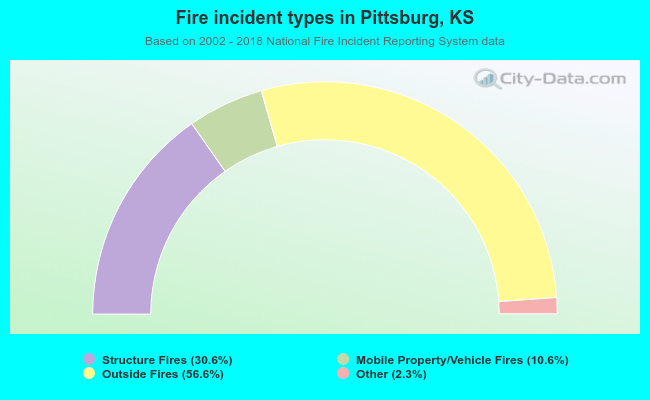 When looking into fire subcategories, the most reports belonged to: Outside Fires (56.6%), and Structure Fires (30.6%).