Bellevue: Fire Incidents, Pennsylvania (PA)
Where are fire incidents reported in Bellevue, PA
Something went wrong! Please refresh the page.
|
| |||||||||||||||||||||||||||||||||||||||||||||||||||||||||||||||||||||||||||||||||||||||||||||||||||||||||||||
2004 - 2018 National Fire Incident Reporting System (NFIRS) incidents
- Incident types reported to NFIRS in Bellevue, PA
- 20924.8%False Alarm
- 16719.8%Fire
- 16219.2%Hazardous Condition
- 13716.3%Good Intent Call
- 12014.2%Rescue & EMS
- 394.6%Service Call
- 40.5%Overpressure Rupture
- 30.4%Special Incident
- 20.2%Severe Weather
- Fire incident types reported to NFIRS in Bellevue, PA
- 10059.9%Structure Fires
- 3219.2%Other
- 2414.4%Outside Fires
- 116.6%Mobile Property/Vehicle Fires
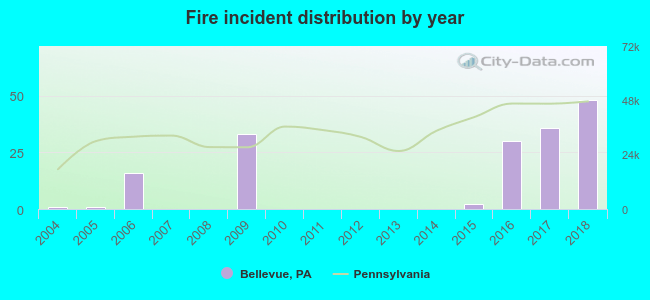 Based on the data from the years 2004 - 2018 the average number of fires per year is 11. The highest number of reported fire incidents - 48 took place in 2018, and the least - 0 in 2007. The data has an increasing trend.
The average number of yearly fire incidents per 10k residents in Bellevue, PA compared to nearest cities:
(Note: Based on data for the last 3 years, including only cities with population 5,000 and above)
| Bellevue: | 45.8 |
| Stowe Township: | 3.1 |
| McKees Rocks: | 72.8 |
| West View: | 31.8 |
| Ross Township: | 1.8 |
| Kennedy Township: | 3.5 |
| Crafton: | 25.4 |
| Robinson Township: | 5.5 |
| Glenshaw: | 2.6 |
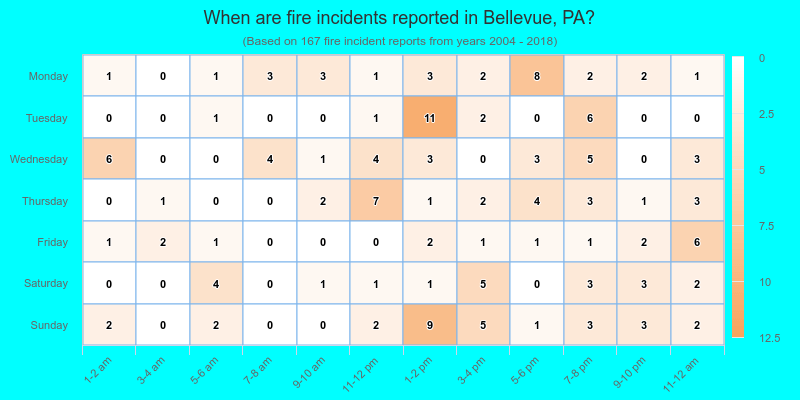
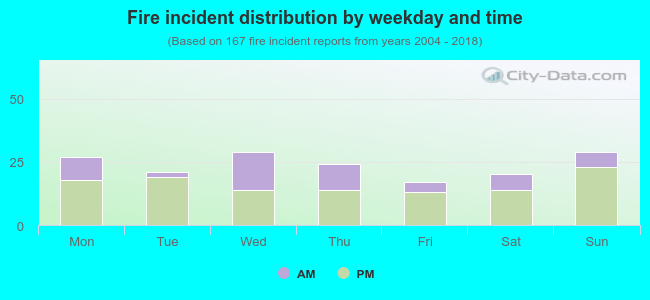 31.1% incidents where reported in the morning and 68.9% in the evening. The most fires (17.4%) took place on Wednesday, and the least (10.2%) on Friday.
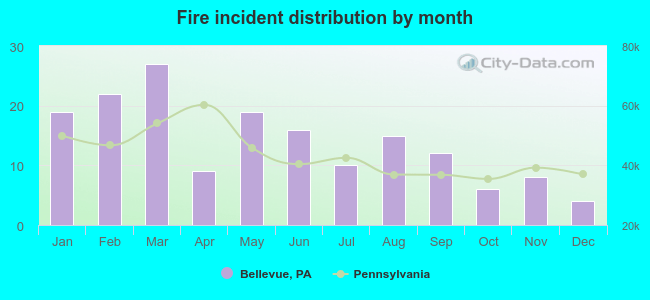 Based on the 167 fires from years 2004 - 2018 most fires (16.2%) took place during March, and the least (2.4%) in December.
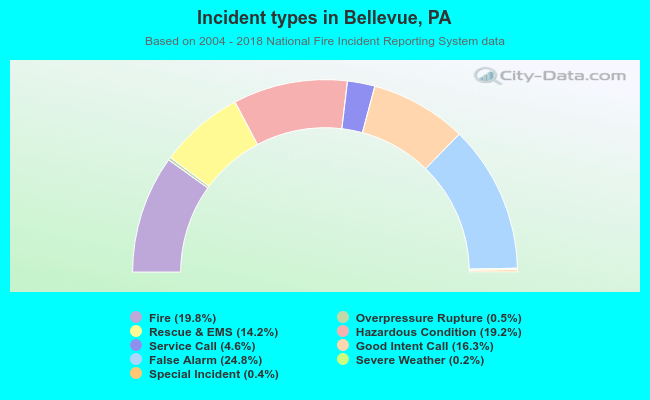 Out of all 843 cases reported during the years 2004 - 2018, the most belonged to the categories: False Alarm (24.8%), Fire (19.8%), and Hazardous Condition (19.2%).
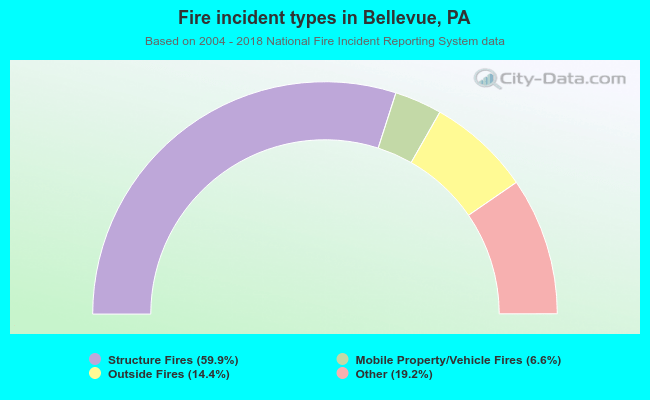 When looking into fire subcategories, the most incidents belonged to: Structure Fires (59.9%), and Other (19.2%).