Glenshaw: Fire Incidents, Pennsylvania (PA)
Where are fire incidents reported in Glenshaw, PA
Something went wrong! Please refresh the page.
|
| |||||||||||||||||||||||||||||||||||||||||||||||||||||||||||||||||||||||||||||||||||||||||||||||||||||||||||||
2004 - 2018 National Fire Incident Reporting System (NFIRS) incidents
- Incident types reported to NFIRS in Glenshaw, PA
- 35449.2%Hazardous Condition
- 23933.2%Fire
- 385.3%Good Intent Call
- 365.0%False Alarm
- 273.8%Rescue & EMS
- 212.9%Service Call
- 40.6%Severe Weather
- 10.1%Special Incident
- Fire incident types reported to NFIRS in Glenshaw, PA
- 12753.1%Structure Fires
- 5020.9%Outside Fires
- 3514.6%Other
- 2711.3%Mobile Property/Vehicle Fires
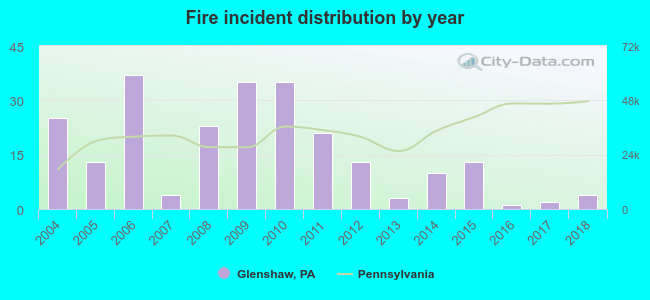 According to the data from the years 2004 - 2018 the average number of fires per year is 16. The highest number of fires - 37 took place in 2006, and the least - 1 in 2016. The data has a declining trend.
The average number of yearly fire incidents per 10k residents in Glenshaw, PA compared to nearest cities:
(Note: Based on data for the last 3 years, including only cities with population 5,000 and above)
| Glenshaw: | 2.6 |
| Allison Park: | 14.2 |
| Ross Township: | 1.8 |
| West View: | 31.8 |
| Fox Chapel: | 10.5 |
| Bellevue: | 45.8 |
| Pittsburgh: | 25.4 |
| McKees Rocks: | 72.8 |
| Stowe Township: | 3.1 |
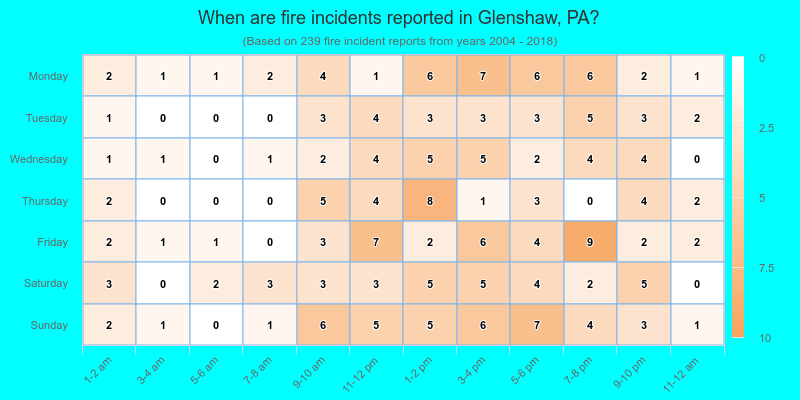
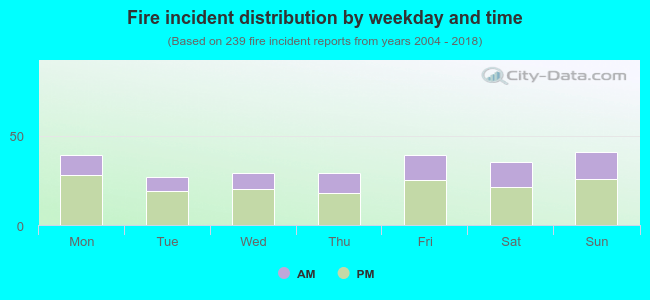 34.3% incidents where reported in the morning and 65.7% in the evening. The most fires (17.2%) took place on Sunday, and the least (11.3%) on Tuesday.
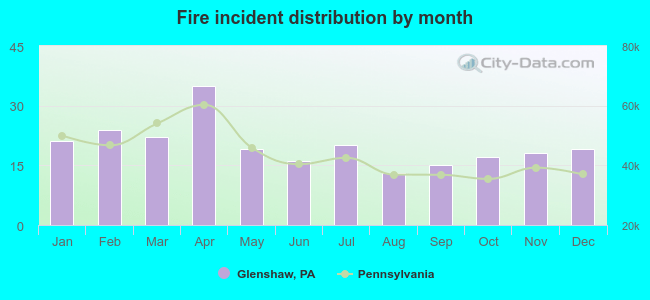 Based on the 239 fire incidents from years 2004 - 2018 most fires (14.6%) took place during April, and the least (5.4%) in August.
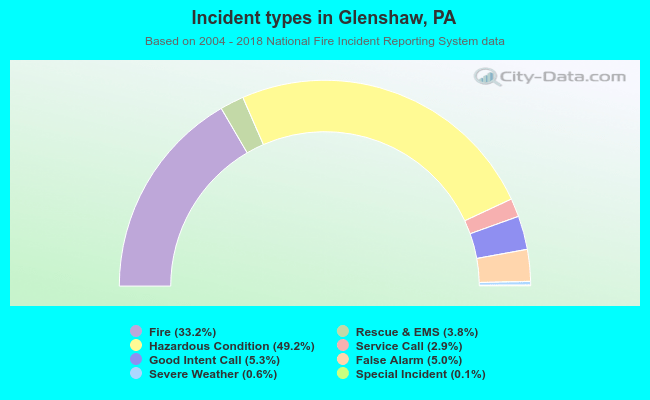 Out of all 720 cases reported during the years 2004 - 2018, the most belonged to the categories: Rescue & EMS (49.2%), Fire (33.2%), and Service Call (5.3%).
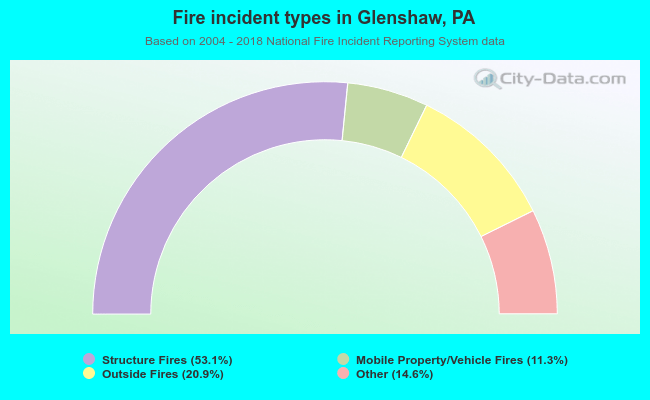 When looking into fire subcategories, the most incidents belonged to: Structure Fires (53.1%), and Outside Fires (20.9%).