Berea: Fire Incidents, Ohio (OH)
Where are fire incidents reported in Berea, OH
Something went wrong! Please refresh the page.
| Fire incidents reported | |
|---|---|
| Sreet name | Count |
| BAGLEY RD | 118 |
| FRONT ST. | 54 |
| BAGLEY | 50 |
| W. BAGLEY RD. | 38 |
| BARRETT RD. | 28 |
| FRONT ST | 28 |
| N.R.R.DR. | 26 |
| PROSPECT | 24 |
| W BAGLEY RD | 24 |
| EMERSON DR. | 22 |
| LONGFELLOW | 16 |
| S.R.R.DR. | 16 |
| W BAGLEY | 16 |
| WEST BAGLEY ROAD | 16 |
| WYLESWOOD DR | 16 |
| SEMINARY | 14 |
| BARRETT | 12 |
| BRIDGE ST | 12 |
| EASTLAND RD. | 12 |
| ROCKY RIVER DR | 12 |
| BARRETT RD | 10 |
| BEECH ST | 10 |
| E BAGLEY | 10 |
| BAKER ST | 8 |
| FAIRPARK | 8 |
| LEWIS RD | 8 |
| NOBOTTOM RD. | 8 |
| PROSPECT ST | 8 |
| PROSPECT ST. | 8 |
| SPRAGUE RD | 8 |
| Other | 140 |
2002 - 2018 National Fire Incident Reporting System (NFIRS) incidents
- Incident types reported to NFIRS in Berea, OH
- 1,07125.2%Hazardous Condition
- 78018.4%Fire
- 77518.2%Rescue & EMS
- 57913.6%Service Call
- 52112.3%Good Intent Call
- 48911.5%False Alarm
- 130.3%Special Incident
- 120.3%Overpressure Rupture
- 80.2%Severe Weather
- Fire incident types reported to NFIRS in Berea, OH
- 40551.9%Structure Fires
- 28236.2%Outside Fires
- 8310.6%Mobile Property/Vehicle Fires
- 101.3%Other
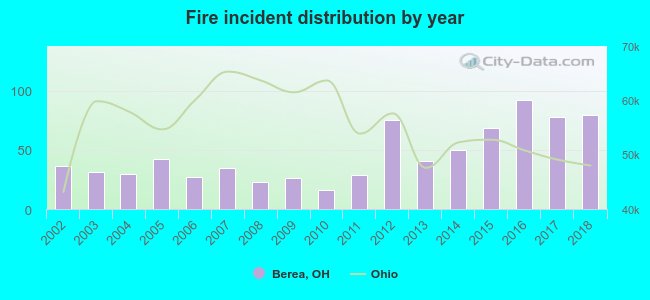 According to the data from the years 2002 - 2018 the average number of fire incidents per year is 46. The highest number of fires - 92 took place in 2016, and the least - 16 in 2010. The data has an increasing trend.
The average number of yearly fire incidents per 10k residents in Berea, OH compared to nearest cities:
(Note: Based on data for the last 3 years, including only cities with population 5,000 and above)
| Berea: | 43.9 |
| Olmsted Falls: | 40.9 |
| Middleburg Heights: | 26.2 |
| Brook Park: | 25.1 |
| North Olmsted: | 39.7 |
| Strongsville: | 22.2 |
| Fairview Park: | 33.2 |
| Parma Heights: | 23.9 |
| Westlake: | 30.5 |
 The median response time based on all reported fire incidents is 5 minutes. This is lower compared to the state median value.
The median response time in Berea, OH compared to nearest cities:
(Note: Based on data for all years, including only cities with at least 500 fire incidents)
| Berea: | 5 minutes |
| Brook Park: | 5 minutes |
| North Olmsted: | 4 minutes |
| Strongsville: | 6 minutes |
| Fairview Park: | 5 minutes |
| Parma Heights: | 3 minutes |
| Westlake: | 6 minutes |
| North Royalton: | 5 minutes |
| Parma: | 4 minutes |
 Based on the data from the years 2002 - 2018 the average number of fire-related yearly deaths is 0. The highest number of reported deaths - 2 took place in 2015, and the lowest - 0 in 2002. The data has a constant trend.
 Based on the data from the years 2002 - 2018 the average number of fire-related yearly casualties is 1. The highest number of casualties - 3 took place in 2016, and the lowest - 0 in 2002. The data has a constant trend.
The average number of injuries per 1,000 fire incidents is 18. This indicator was the highest - 87 in 2008, and the lowest 0 in 2002. The trend for casualties per 1,000 fire incidents is declining. Compared to the state value the number of casualties per 1,000 fires is similar.
Based on the data from the years 2002 - 2018 the average number of fire-related yearly casualties is 1. The highest number of casualties - 3 took place in 2016, and the lowest - 0 in 2002. The data has a constant trend.
The average number of injuries per 1,000 fire incidents is 18. This indicator was the highest - 87 in 2008, and the lowest 0 in 2002. The trend for casualties per 1,000 fire incidents is declining. Compared to the state value the number of casualties per 1,000 fires is similar.Casualties per 1,000 incidents in Berea, OH compared to nearest cities:
(Note: Based on data for all years, including only cities with at least 500 fire incidents)
| Berea: | 15.4 |
| Brook Park: | 25.0 |
| North Olmsted: | 10.2 |
| Strongsville: | 9.1 |
| Fairview Park: | 7.1 |
| Parma Heights: | 43.3 |
| Westlake: | 27.5 |
| North Royalton: | 11.0 |
| Parma: | 19.1 |
 28.5% incidents where reported in the morning and 71.5% in the evening. The most fires (14.9%) took place on Wednesday, and the least (13.3%) on Thursday.
 According to the 780 reports from years 2002 - 2018 most fires (14.7%) took place during June, and the least (4.7%) in February.
 Out of all 4,248 cases reported during the years 2002 - 2018, the most belonged to the categories: Hazardous Condition (25.2%), Fire (18.4%), and Rescue & EMS (18.2%).
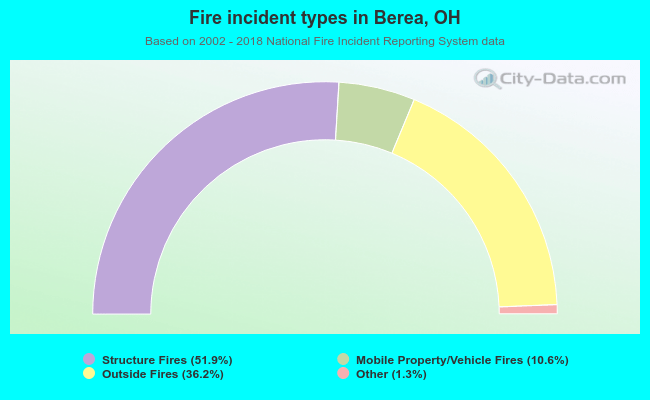 When looking into fire subcategories, the most reports belonged to: Structure Fires (51.9%), and Outside Fires (36.2%).