Middleburg Heights: Fire Incidents, Ohio (OH)
Where are fire incidents reported in Middleburg Heights, OH
Something went wrong! Please refresh the page.
|
| |||||||||||||||||||||||||||||||||||||||||||||||||||||||||||||||||||||||||||||||||||||||||||||||||||||||||||||
2002 - 2018 National Fire Incident Reporting System (NFIRS) incidents
- Incident types reported to NFIRS in Middleburg Heights, OH
- 8,88178.1%Rescue & EMS
- 1,15610.2%False Alarm
- 3853.4%Hazardous Condition
- 3843.4%Service Call
- 2812.5%Good Intent Call
- 2242.0%Fire
- 400.4%Special Incident
- Fire incident types reported to NFIRS in Middleburg Heights, OH
- 12354.9%Structure Fires
- 7433.0%Outside Fires
- 2611.6%Mobile Property/Vehicle Fires
- 10.4%Other
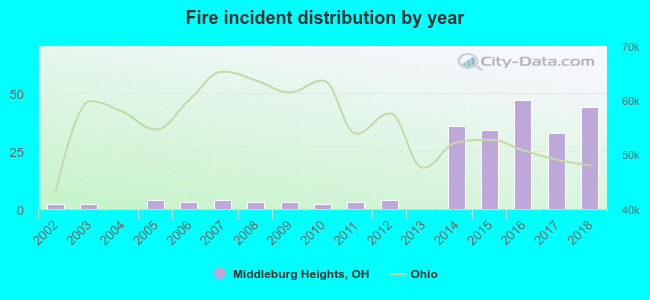 Based on the data from the years 2002 - 2018 the average number of fires per year is 13. The highest number of fire incidents - 47 took place in 2016, and the least - 0 in 2004. The data has an increasing trend.
The average number of yearly fire incidents per 10k residents in Middleburg Heights, OH compared to nearest cities:
(Note: Based on data for the last 3 years, including only cities with population 5,000 and above)
| Middleburg Heights: | 26.2 |
| Brook Park: | 25.1 |
| Parma Heights: | 23.9 |
| Berea: | 43.9 |
| Strongsville: | 22.2 |
| North Royalton: | 19.5 |
| Parma: | 21.2 |
| Olmsted Falls: | 40.9 |
| Fairview Park: | 33.2 |

 31.3% incidents where reported in the morning and 68.8% in the evening. The most fires (19.2%) took place on Thursday, and the least (8.9%) on Monday.
 Based on the 224 fires from years 2002 - 2018 most fires (12.5%) took place during April, and the least (4.0%) in February.
 Out of all 11,365 cases reported during the years 2002 - 2018, the most belonged to the categories: Rescue & EMS (78.1%), False Alarm (10.2%), and Hazardous Condition (3.4%).
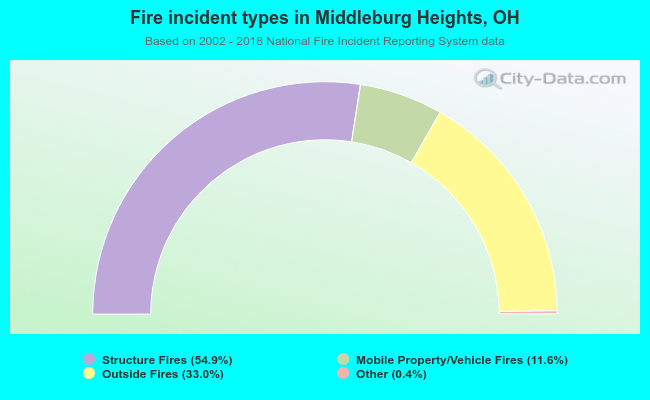 When looking into fire subcategories, the most reports belonged to: Structure Fires (54.9%), and Outside Fires (33.0%).